Short Answer
Figure 21-30 The graph shows two budget constraints for a consumer. 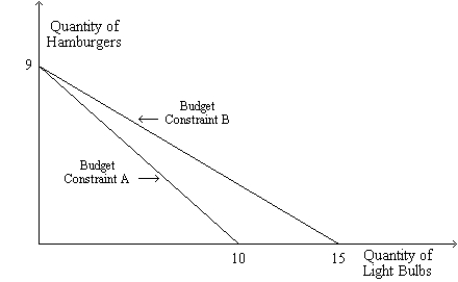
-Refer to Figure 21-30. Suppose the consumer's income is $90 and Budget Constraint A applies. What is the price of a light bulb?
Definitions:
Related Questions
Q76: Suppose that you have $100 today and
Q76: According to behavioral economics, an employee will
Q146: The Condorcet paradox shows that<br>A) allocations of
Q197: Refer to Table 22-11. If the vote
Q307: Mark spends his weekly income on gin
Q321: Assume you are a critic of welfare
Q331: Refer to Table 22-16. Mr. Johnson recommends
Q334: Which of the following is an example
Q359: Explain what is meant by "in-kind transfer"
Q414: Which of the following is not a