Figure TB-4.5 shows a level 0 logical data flow diagram for a billing system. Also shown for reference is the context diagram for the system. The logical data flow diagram intentionally violates several of the guidelines and other techniques presented in the text for drawing data flow diagrams.
Required:
Identify as many of the errors in the logical data flow diagram construction as you can. In the logical data flow diagram, place consecutive numbers (each in a circle) next to the points at which the errors exist. On your solution sheet, list the numbers and write a one- to two-sentence description of each error and what the corrected diagram should depict. If an error occurs in more than one place, mark each occurrence of the error. Error 1 is provided as an example of how to construct the solution. Do not identify nor correct any errors that may exist on the context diagram.
\begin{array}{c}\begin{array}{lll}\underline{Error }\\1\\\\\\\\\\\\\\end{array}\begin{array}{lll}\underline{Error Description}\\\text{The flow from bubble 2.1 to the Accounts receivable department is not labeled. The}\\ \text{flow on the context diagram indicates that copy 3 of the sales invoice is sent to the}\\ \text{accounts receivable department.}\\\text{Correction: Add a label to the flow from bubble 2.1 to the Accounts receivable}\\\text{department. But, because data flows on a logical data flow diagram (DFD) should}\\\text{describe the nature of the data not how the data are transmitted, we should label this}\\\text{flow "Record sales invoice"}\end{array}\end{array} 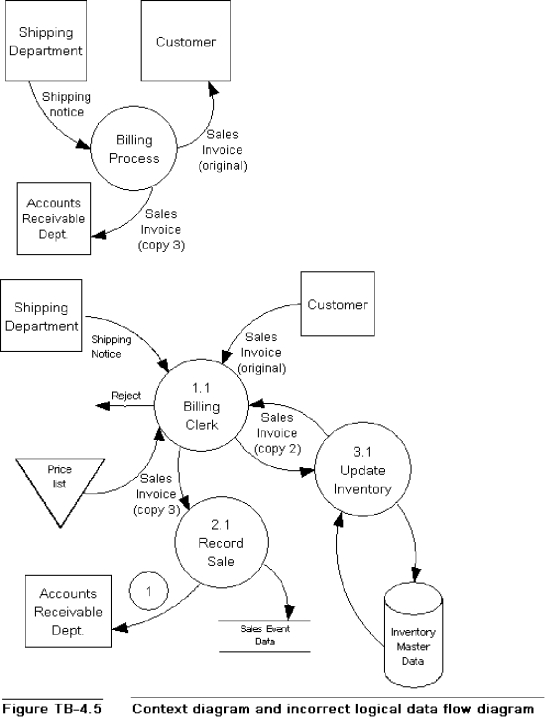
Definitions:
Cognitive Development
Cognitive development is the study of how children and adults develop thinking and reasoning skills over time, including memory, problem-solving, and decision-making abilities.
Debit Memorandum
An internal document sent from one department to another within a company to notify an adjustment of accounts, usually an increase in expense or a decrease in assets.
Merchandise Inventory
Refers to the goods that a company has on hand for the purpose of selling to customers.
Sales Discount
A reduction in the sale price offered by a seller to a buyer, typically to prompt early payment or reward customer loyalty.
Q7: Which of the following statements related to
Q11: A(n) _ database model allows both simple
Q19: An acceptance stub is a data flow
Q23: Forced vacations is a policy of requiring
Q42: A secondary key uniquely identifies any row
Q58: _ map and define the way in
Q75: _ requires information to assess the environment
Q96: What is the correct sequence of the
Q100: _ values waste memory space and may
Q110: Software that manages the interactions with the