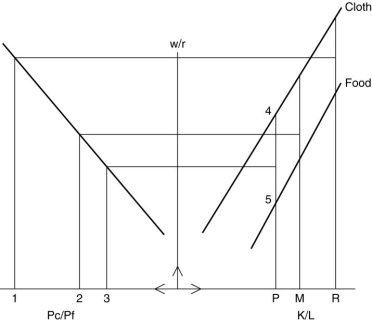
-Refer to above figure. Two countries exist in this model, P and R. P is relatively labor (L) abundant, as is evident in the bottom right horizontal axis. If Country P were to be completely specialized in the labor-intensive product, C, it would be producing at point 4. In fact, it produces both C and P, at point 5. The (autarky) relative price of C (in terms of
F) of Country P is at point 3; and of Country R at point If trade were to open up between these two countries, which would export C and which would export F? Is this consistent with the Heckscher-Ohlin model? Explain.
Definitions:
Histogram
A graphical representation of the distribution of numerical data, showing the frequency of data intervals.
Behavioral Sciences
A field of study that explores the activities and interactions among human beings and their environments.
Social Sciences
Disciplines that study societies and the relationships among individuals within those societies, including economics, political science, sociology, and psychology.
Charts
Graphical representations of data, designed to visually compare different quantities, values, or items.
Q2: Ricardian equivalence argues that when the government<br>A)
Q5: Where there are internal economies of scale,
Q5: Mark broke his left arm after he
Q12: The Neoclassical Heckscher-Ohlin model assumes that all
Q12: Mushrooms, yeast, and mold are edible forms
Q26: In the specific factors model, a country's
Q35: Refer to above figure. What happens to
Q35: Given the information in the table above.
Q43: The term mass is often used to
Q50: The physician documented Jacob's diagnosis as a