The table below shows the sales for a plastics manufacturer recorded over the past year. The seasonal indexes for each quarter are also provided. To track the trend for these four quarters, use the indexes to deseasonalize the sales data 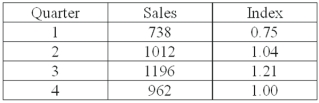 What is the deseasonalized sales value for quarter 3?
Definitions:
Q16: If the coefficient of determination is 0.81,
Q44: The forecast for the third quarter is
Q66: What happens as the scatter of data
Q77: The following linear trend equation was developed
Q81: What is the proportion of explained variation
Q93: The Paasche method uses the amounts consumed
Q97: A multiple regression analysis showed the following
Q112: The standard error of the estimate measures
Q125: The Consumer Price Index (1982-84 = 100)
Q129: The regression equation is ? =