Marin Products produces three products - DBB-1,DBB-2,and DBB-3 from a joint process.Each product may be sold at the split-off point or processed further.Additional processing requires no special facilities,and production costs of further processing are entirely variable and traceable to the products involved.Key information about Marin's production,sales,and costs follows. 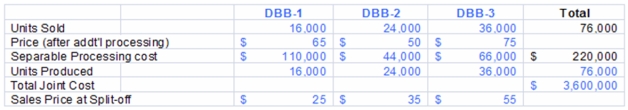
The amount of joint costs allocated to product DBB-3 using the net realizable value method is (calculate all ratios and percentages to 4 decimal places,for example 33.3333%,and round all dollar amounts to the nearest whole dollar) :
Definitions:
Quick Layout Button
A feature in spreadsheet and presentation software that allows rapid changes to the layout of charts, tables, or slides for better visualization.
PivotChart Layout
The arrangement and visual design of elements in a PivotChart, a graphical representation of data in a PivotTable in spreadsheet software, which can be customized.
Corresponding PivotTable
A feature in spreadsheet software that automatically generates a summarizing table from a selection of data, allowing for dynamic analysis and reporting.
Insert Slicers
A feature in spreadsheet software that allows users to filter data in pivot tables or charts visually, enabling more interactive and easier analysis of large data sets.
Q12: Beckner Inc.is a job-order manufacturer.The company uses
Q15: A time ticket:<br>A)Shows the time an employee
Q22: Assume the following information pertaining to Moonbeam
Q23: Learning Curves Moss Point Manufacturing recently completed
Q24: Operation costing is a hybrid costing system
Q70: Which of the following best describes a
Q85: Volume-based cost accounting systems often do a
Q90: Which of the following companies (industries)would not
Q94: Which one of the following statements concerning
Q110: National Inc.manufactures two models of CMD that