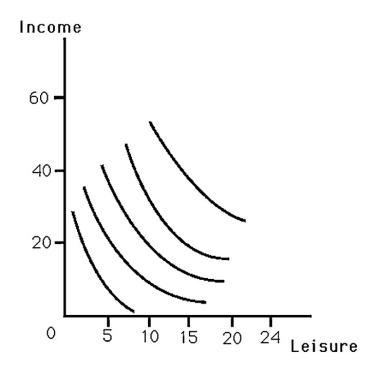
-The above figure shows an indifference map for a person's choices between leisure and consumption.Derive this person's labor supply curve for wage rates of $5,$10,and $15.
Definitions:
Aggregate Demand Curve
A graphical representation that shows the relationship between the overall price level and the total demand for goods and services in an economy.
Short-run Aggregate Supply Curve
Illustrates the relationship between the overall price level and the total output of goods and services that firms in an economy are willing to produce, assuming some prices are sticky.
Money Supply Curve
A graphical representation showing the relationship between the quantity of money in the economy and the level of prices.
Inverse Relationship
A situation where two variables move in opposite directions, meaning when one variable increases, the other decreases, and vice versa.
Q16: The "Got Milk?" advertising campaign is a
Q34: If a person supplies more hours of
Q42: The implementation of the assembly line is
Q45: The production function for hamburgers can be
Q63: The fact that consumers often react more
Q98: Suppose the current price and quantity of
Q98: The above figure shows the cost curves
Q99: Which of the following will cause the
Q102: Joe's indifference map for lobster and soda
Q179: Suppose a market were currently at equilibrium.A