Multiple Choice
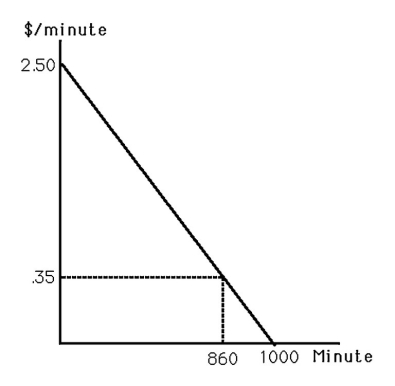
-The above figure shows the market demand curve for telecommunication while driving one's car (time spent on the car phone) .At the current price of 35¢ per minute,consumer surplus equals
Definitions:
Related Questions
Q10: A small business owner earns $50,000 in
Q29: Suppose the demand function for a good
Q36: Draw two graphs,one directly above the other.On
Q48: An organization that converts inputs (like Labor,Capital
Q65: Which of the following utility functions has
Q67: An increase in the cost of an
Q82: If two goods are perfect substitutes,then the
Q86: When the isocost line is tangent to
Q89: Economies of scope exist between book publishing
Q106: Assuming a horizontal long-run market supply curve,which