Essay
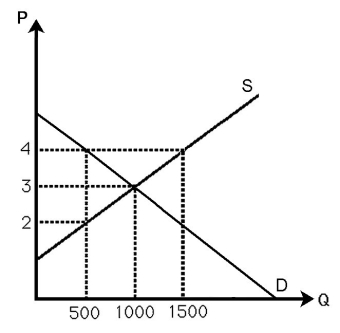
-The above figure shows the demand and supply curves in the market for milk.Currently the market is in equilibrium.If the government establishes a $4 per gallon price support,estimate the change in p,Q,and social welfare.
Definitions:
Related Questions
Q19: Why does a monopsonist's marginal expenditure curve
Q31: Suppose that for each firm in the
Q37: At the current price of a good,Al's
Q58: If a firm doesn't make an economic
Q63: The above figure shows supply and demand
Q67: An increase in the cost of an
Q68: Efficient production occurs if a firm<br>A)cannot produce
Q80: If marginal productivity is increasing,then total product
Q112: Consider a firm with two technologies to
Q130: When attempting price regulation,a government faces what