Multiple Choice
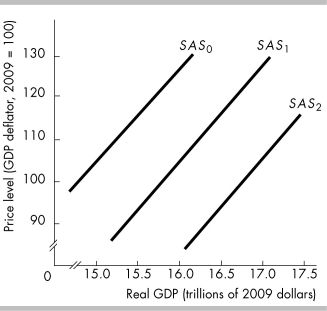
-In the above figure, the short-run aggregate supply curve is SAS1. If the prices of resources fall, there is
Definitions:
Related Questions
Q45: During most of the 1980s, 1990s, and
Q71: Suppose X - M = net exports;
Q75: The short-run aggregate supply curve is upward
Q149: In the figure above, the shift in
Q245: According to the data in the above
Q284: Dissaving<br>A) is equal to consumption expenditure when
Q296: The aggregate demand curve shows that, if
Q388: Which of the following changes while moving
Q428: Suppose the price level rises and the
Q470: Assume that there is an increased demand