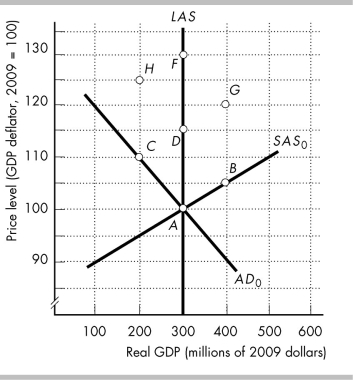
-The figure above shows the initial aggregate demand curve, AD?, the initial short-run aggregate supply curve, SAS?, and the long-run aggregate supply curve, LAS. The points in the figure show possible combinations of real GDP and the price level at which the economy of Atlantia is in macroeconomic equilibrium. The economy is initially at point A. Then, the government increases its expenditure on goods and services. Draw the new aggregate demand and short-run aggregate supply curves in the figure to show the effects of this event on Atlantia's real GDP and price level.
a)What happens to Atlantia's potential GDP?
b)In the short run, what happens to aggregate supply and aggregate demand?
c)What are the new short-run equilibrium real GDP and price level?
d)In the long run, what happens to the short-run aggregate supply and aggregate demand?
e)What are the new long-run equilibrium real GDP and price level?
Definitions:
Total Rate of Return
The comprehensive yield on an investment over a specific period, considering both capital gains and dividends or interest, expressed as a percentage of the initial investment.
Dividend Growth Model
A valuation method that estimates the price of a company’s stock based on the dividend per share and the dividend growth rate.
Constant Rate
A fixed rate, without variation or fluctuation over time.
Dividends
Dividends are payments made by a corporation to its shareholder members, usually derived from the company's profits.
Q73: When the Federal Reserve increases the Federal
Q102: Which of the following statements about the
Q130: What is demand-pull inflation?
Q153: The Federal Open Market Committee meets _
Q185: An economy is in long-run equilibrium and
Q204: To decrease inflation, the Federal Reserve would
Q218: A positive output gap is an inflationary
Q276: What are criticisms of the real business
Q348: To end a deflation, the government must<br>A)
Q397: In an article regarding Bangladesh's economy, the