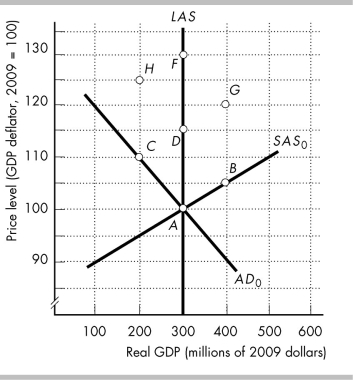
-The figure above shows the initial aggregate demand curve, AD?, the initial short-run aggregate supply curve, SAS?, and the long-run aggregate supply curve, LAS. The points in the figure show possible combinations of real GDP and the price level at which the economy of Atlantia is in macroeconomic equilibrium. The economy is initially at point A. Atlantia's Central Bank then increases the quantity of money year after year. Draw the necessary curves in the figure to show the effects of this on Atlantia's real GDP and price level.
a)What happens to Atlantia's potential GDP?
b)In the short run, what happens to aggregate supply and aggregate demand?
c)What are the new short-run equilibrium real GDP and price level?
d)In the long run, what happens to aggregate supply and aggregate demand?
e)In the long run, what process is unfolding?
Definitions:
Uncollectibles
Debts from customers that are considered impossible to collect and are therefore written off as a loss.
Expense with Revenues
Represents the relationship between the costs incurred and the revenues generated in a specific period.
Direct Write-off Method
An accounting method for treating bad debts that writes off specific invoices as uncollectable only at the time they are deemed irrecoverable.
Allowance Method
An accounting technique used to estimate and account for doubtful accounts, providing a more accurate reflection of realizable revenue.
Q23: The slope of the AE curve is
Q69: Equilibrium in the market for bank reserves
Q93: In the above figure, the movement from
Q102: The People's Bank of China announced that
Q105: The cyclical deficit is the portion of
Q150: The above table gives information for the
Q168: Which of the following is NOT a
Q288: A one-time increase in the price of
Q352: The new Keynesian cycle theory of the
Q369: In the above figure, suppose the economy