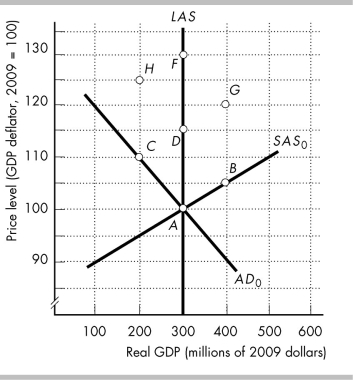
-The figure above shows the initial aggregate demand curve, AD?, the initial short-run aggregate supply curve, SAS?, and the long-run aggregate supply curve, LAS. The points in the figure show possible combinations of real GDP and the price level at which the economy of Atlantia is in macroeconomic equilibrium. The economy is initially at point A. Then, the government increases its expenditure on goods and services. Draw the new aggregate demand and short-run aggregate supply curves in the figure to show the effects of this event on Atlantia's real GDP and price level.
a)What happens to Atlantia's potential GDP?
b)In the short run, what happens to aggregate supply and aggregate demand?
c)What are the new short-run equilibrium real GDP and price level?
d)In the long run, what happens to the short-run aggregate supply and aggregate demand?
e)What are the new long-run equilibrium real GDP and price level?
Definitions:
Reliabilities
Reliability refers to the consistency and dependability of a system or process to perform its intended function under specified conditions over a certain period.
Q103: The _ states that the main source
Q157: Ben Bernanke (the 14th Chairman of the
Q195: In the above figure, if the economy
Q195: Price level stability<br>A) has no relationship to
Q217: The Taylor Rule states that the<br>A) Fed
Q288: A one-time increase in the price of
Q313: If the price level is constant, a
Q344: In an article regarding Bangladesh's economy, the
Q389: As far as cost-push inflation goes, the
Q405: The short-run Phillips curve shows the tradeoff