Multiple Choice
FIGURE 7-1 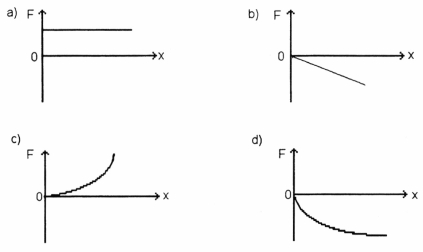
-Which of the graphs in Figure 7-1 represents a spring which gets less stiff the more it is stretched?
Definitions:
Related Questions
Q7: Neglecting air resistance, when you toss a
Q11: A solid cylinder with a radius of
Q11: An object is thrown upwards with a
Q15: A 50.0-kg person stands on a 200-kg
Q29: An object is moving with constant velocity.
Q54: A bullet is fired from ground level
Q73: The mass of a proton is 1.7
Q82: The drive chain in a bicycle is
Q86: A satellite completes one full orbit around
Q100: A hoop with a mass of 2.75