FIGURE 15-13 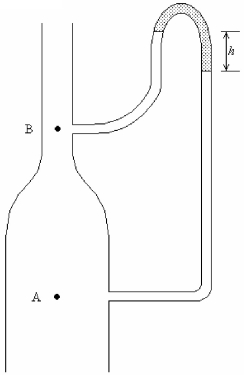
-Water flows in the vertical pipe shown in Figure 15-13. At A the area is 25.0 cm2 and the speed of the water is 0.750 m/s. At B the area is 16.0 cm2. The fluid in the manometer is oil, which has a density of 800 kg/m3. What is the manometer reading h?
Definitions:
Statistical Linear Trend Analysis
A technique used in statistics to model and analyze the relationship between variables and a continuous outcome over time.
Strategic Marketing Process
The approach a company takes to plan and execute marketing activities to reach their target audience and achieve competitive advantage.
Evaluation Phase
The stage in a project or campaign where outcomes are assessed against objectives to determine success and inform future decisions.
Evaluation Phase
A stage in a product's development or in a marketing campaign where its effectiveness, impact, or success is assessed.
Q1: Order in one part of the universe
Q1: Curve A in Figure 13-1 represents<br>A) an
Q4: Point charges of + 2.0 μC, +
Q38: Electric field lines and equipotential lines meet
Q74: When objects at different temperatures are brought
Q74: Infrasound carries over long distances better than
Q75: State the Third Law of Thermodynamics
Q76: When you walk barefoot in a room,
Q76: If the net force on an object
Q83: A child runs and jumps tangentially onto