Figure 2.3 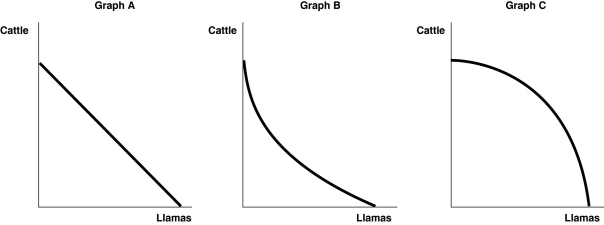 Alt text for Figure 2.3: In figure 2.3, 3 graphs, A, B and C comparing production of cattle and llamas.
Long description for Figure 2.3: Graph A: the x-axis is labelled, llamas, and y-axis is labelled, cattle.A line slopes down from the top left corner of the quadrant, near the top of the y-axis to the bottom right corner, near the end of the x-axis.Graph B: the x-axis is labelled, llamas, and y-axis is labelled, cattle.A convex curve begins in the top left corner, near the top of the y-axis and ends in the bottom right corner, near the end of the x-axis.Graph C: the x-axis is labelled, llamas, and y-axis is labelled, cattle.A concave curve begins in the top left corner near the top of the y-axis, and ends in the bottom right corner, near the end of the x-axis.
-Refer to Figure 2.3.Sergio Vignetto raises cattle and llamas on his land.Half the land is more suitable for raising cattle and half the land is better suited for raising llamas.Which of the graphs in Figure 2.3 represent his production possibilities frontier?
Definitions:
Embryonic Stage
A critical period in prenatal development covering the first 8 weeks after fertilization, when the basic structures of the organism begin to form.
Post-Natal Stage
The period following childbirth, focusing on the mother's recovery and the baby's adaptation to life outside the womb.
Embryonic
Referring to an early developmental stage in animals and plants; in humans, it covers the first eight weeks after fertilization.
Foetal
Pertaining to a fetus, the developmental stage of a vertebrate occurring in the womb before birth.
Q16: The negotiation process involves several steps such
Q16: If opportunity costs are _,the production possibilities
Q38: Project managers should not lie to themselves
Q42: The Schedule Performance Index (SPI)is a measure
Q54: Economists reason that the optimal decision is
Q87: Following the successful launch of Red Bull
Q107: Alberta ranchers can raise either cattle or
Q122: What is the difference between product markets
Q244: Comparative advantage means the ability to produce
Q306: Holding everything else constant,a decrease in the