Figure 2.9 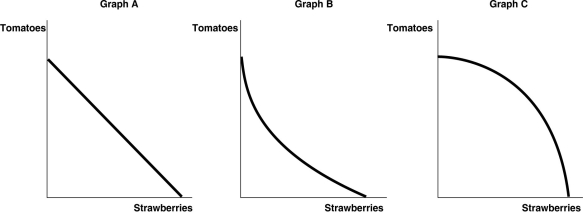 Alt text for Figure 2.9: In figure 2.9, 3 graphs, A, B, and C depict production possibilities frontier for Carlos Vanya.
Long description for Figure 2.9: Graph A: The x-axis is labelled, strawberries, and the y-axis is labelled, tomatoes.A line slopes from the top left corner of the quadrant, near the end of the y-axis, down to the bottom right corner, near the end of the x-axis.Graph B: The x-axis is labelled, strawberries, and the y-axis is labelled, tomatoes.A concave curve begins in the top left corner of the quadrant, near the top of the y-axis, and ends near the end of the y-axis.Graph C: The x-axis is labelled, strawberries, and the y-axis is labelled, tomatoes.A convex curve begins in the top left corner, near the top of the y-axis, and ends in the bottom right corner, near the end of the y-axis.
-Refer to Figure 2.9.Carlos Vanya grows tomatoes and strawberries on his land.A portion of his land is more suitable for growing tomatoes and the other portion is better suited for strawberry cultivation.Which of the graphs in Figure 2.9 represent his production possibilities frontier?
Definitions:
Inka Empire
A powerful South American empire that thrived in the Andes region from the 12th to the early 17th century, known for its advanced architectural and agricultural techniques.
Communications
The process of transmitting information, ideas, and feelings through the use of signs, symbols, words, pictures, figures, and actions.
Roads
Pathways made for traveling between places, crucial for the development of civilizations by enabling trade, movement, and communication.
Northwest Coast Indians
Indigenous peoples known for their complex clan systems, totem poles, and intricate art styles in the Pacific Northwest region of North America.
Q2: All of these describe contemporary methods of
Q13: Project partnerships offer which of the following
Q27: Marginal analysis involves undertaking an activity<br>A)until its
Q31: Effective project partnerships generally require shared responsibilities,shared
Q33: Describe at least three alternative approaches to
Q41: High-performing teams include members who typically hold
Q44: Refer to Figure 2.15.One segment of the
Q272: Refer to Figure 3.14.The graph in this
Q287: Households _ final goods and services in
Q296: Refer to Figure 2.2.The linear production possibilities