Figure 2.10 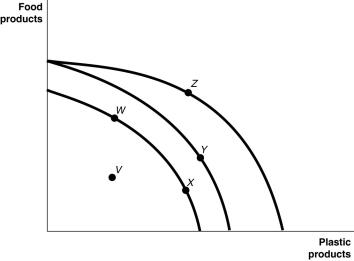 Figure 2.10 shows various points on three different production possibilities frontiers for a nation.
Alt text for Figure 2.10: In figure 2.10, a graph comparing 3 different production possibilities frontiers for a nation.
Long description for Figure 2.10: The x-axis is labelled, plastic products, and the y-axis is labelled, food products.3 convex curves are shown, with points V, W, X, Y, and Z plotted.The first curve begins just past the half-way point on the y-axis, and ends just past the half-way point on the x-axis.Points W and X are plotted along the curve, with point W approximately 1 third of the way from the start of the curve, and point X more than 2 thirds of the way along the curve.The second curve begins almost 3 quarters of the way up the y-axis and ends just past the termination of the first curve on the x-axis.Point Y is plotted on the second curve, approximately 2 thirds of the way along the curve.The third curve begins at the same point as the second curve, and ends approximately 3 quarters of the way along the x-axis.Point Z is plotted on the third curve, a little less than half-way along the curve.Point V is plotted between the first curve and the origin.
-Refer to Figure 2.10.A movement from ________ could occur because of an influx of immigrant labour.
Definitions:
Limited Liability Company
Is a business structure that combines the pass-through taxation of a partnership or sole proprietorship with the limited liability of a corporation.
Personally Liable
Being directly responsible for an obligation or debt, where one's personal assets can be used to satisfy the liability.
Unlimited Liability
A type of business ownership where the owners are personally responsible for all of the debts of the business, with no limit to this liability.
Limited Liability Company
A business structure in the United States that provides its owners with limited liability while allowing the benefits of pass-through taxation.
Q15: Traditional project procurement was characterized by win
Q17: A normal good is a good for
Q28: Refer to Figure 2.14.What is the opportunity
Q34: Refer to Figure 2.12.In response to changing
Q41: Refer to Table 2.14.This table shows the
Q69: Refer to Figure 3.13.Assume that the graphs
Q85: Scarcity<br>A)stems from the incompatibility between limited resources
Q86: "The price of compact LED lights fell
Q106: If a firm expects that the price
Q160: Refer to Figure 3.16.The graph in this