Figure 3.3 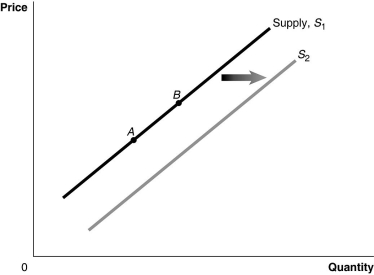 Alt text for Figure 3.3: In figure 3.3, a graph of the effect of an increase in the price of inputs on the supply curve.
Long description for Figure 3.3: The x-axis is labelled, Quantity, and the y-axis is labelled, Price.Curve Supply, S1, is a straight line which slopes up from the bottom left corner to the top right corner.2 points, A and B, are marked in the middle of curve S1.Curve S2 follows the same slope as curve S1, but is plotted to the right.A right pointing arrow indicates the change from curve S1 to curve S2.
-Refer to Figure 3.3.An increase in the number of firms in the market would be represented by a movement from
Definitions:
Q10: Refer to Figure 2.18.Which two arrows in
Q13: Which of the following cause the unemployment
Q24: Which of the following is a positive
Q30: Increases in real GDP would understate the
Q201: The size of the underground economy as
Q212: Refer to Table 4.29.Based on the table
Q232: Debbie makes porcelain plates in her home
Q266: The substitution effect of a price change
Q273: Assume that the hourly price for the
Q274: Quantity supplied refers to the amount of