Figure 3.7 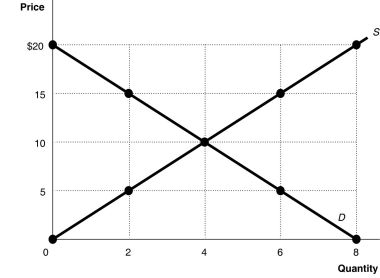 Alt text for Figure 3.7: In figure 3.7, a graph plotting intersecting supply and demand curves illustrates surplus and shortage in a market, along with an equilibrium.
Long description for Figure 3.7: The x-axis is labelled, Quantity, and is marked from 0 to 8 in increments of 2.The y-axis is labelled, Price, and is marked from 0 to 20 dollars in increments of 5.Curve D is a straight line which slopes down from the top left corner to the bottom right corner.Curve S is a straight line which begins in the bottom left corner and slopes up to the top right corner.The equilibrium of the 2 curves is marked at (4,10) .2 points plotted on the demand curve to the left of the equilibrium are (0,20) and (2,15) .2 points plotted on the demand curve to the right of the equilibrium are (6,5) and (8,0) .2 points plotted on the supply curve to the right of the equilibrium are (6,15) and (8,20) .2 points plotted on the supply curve to the left of the equilibrium are (2,5) and (0,0) .
-Refer to Figure 3.7.At a price of $5, the quantity sold
Definitions:
Tastes
Sensory experiences produced by substances in the mouth interacting with taste receptors on the tongue.
Aqueous Humor
A clear, watery fluid in the eye, located between the cornea and the lens, helping to maintain intraocular pressure and provide nutrients to the eye.
Pressure
The force exerted per unit area; in a fluid, it is often due to the weight of the fluid above and is measured in units such as Pascals or pounds per square inch.
Glaucoma
A group of eye conditions that lead to damage to the optic nerve, often associated with increased pressure in the eye, resulting in loss of vision if not treated.
Q18: Statistics Canada would categorize a person as
Q62: The drawback to calculating real GDP using
Q91: Refer to Figure 2.18.Which two arrows in
Q165: Assume that both the demand curve and
Q187: In November 2015 the Purchasing Managers' Index
Q199: Which of the following is evidence of
Q221: All else equal,a shortage of orange juice
Q250: Assume there is a shortage in the
Q300: A major factor contributing to the slow
Q311: Discuss the correct and incorrect economic analysis