Figure 3.8 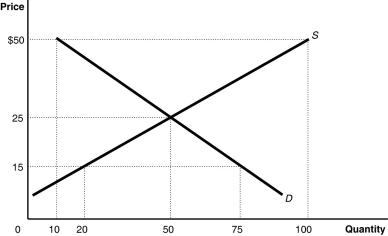 Alt text for Figure 3.8: In figure 3.8, a graph plotting intersecting supply and demand curves represents the market for canvas tote bags.
Long description for Figure 3.8: The x-axis is labelled, Quantity, with the values 0, 10, 20, 50, 75, and 100 marked.The y-axis is labelled, Price, with the values 0, 15, 25, and 50 dollars marked.Curve D is a straight line which slopes down from the top left corner to the bottom right corner.Curve S is a straight line which begins in the bottom left corner and slopes up to the top right corner.The equilibrium of the 2 curves is (50,25) .The point plotted on curve S to the left of equilibrium is (20,15) .The point plotted on curve D to the right of point of equilibrium is (75,15) .The point plotted to the right of equilibrium on curve S is (100,50) .The point plotted to the right of the equilibrium on curve D is (10,50) .
-Refer to Figure 3.8.The figure above represents the market for canvas tote bags.Assume that the price of tote bags is $15.At this price,
Definitions:
Inventory Turnover
A measure of how many times a company's inventory is sold and replaced over a period, indicating the efficiency of inventory management.
Average Daily Cost
The average daily cost refers to the total cost per day, calculated by dividing the total expenses by the number of days in the period under consideration.
Days' Sales
A financial metric that estimates the average time it takes a company to convert its inventory into sales.
Cost Of Goods Sold
Direct expenses associated with creating the goods a company sells, including both materials and labor.
Q9: A firm has an incentive to decrease
Q15: Upon your graduation from university,you find that
Q69: If real GDP increases,we know for sure
Q111: Discouraged workers are classified by Statistics Canada
Q130: Refer to Table 4.1.1.Based on the information
Q137: A full-time student who is not working
Q198: Refer to Figure 2.5.If the economy is
Q207: The output of Canadian citizens who work
Q236: Net national income is equal to<br>A)personal income
Q305: If the price of garlic is represented