Figure 3.11 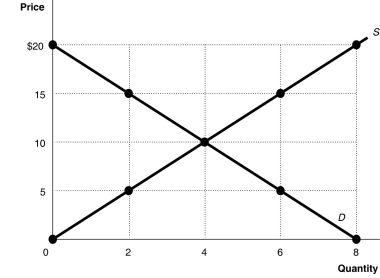 Alt text for Figure 3.11: In figure 3.11, a graph plotting intersecting supply and demand curves illustrates how supply and demand function in competitive markets.
Long description for Figure 3.11: The x-axis is labelled, Quantity, and is marked from 0 to 8 in increments of 2.The y-axis is labelled, Price, and is marked from 0 to 20 dollars in increments of 5.Curve D is a straight line which slopes down from the top left corner to the bottom right corner.Curve S is a straight line which begins in the bottom left corner and slopes up to the top right corner.The equilibrium of the 2 curves is marked at (4,10) .2 points plotted on the demand curve to the left of the equilibrium are (0,20) and (2,15) .2 points plotted on the demand curve to the right of the equilibrium are (6,5) and (8,0) .2 points plotted on the supply curve to the right of the equilibrium are (6,15) and (8,20) .2 points plotted on the supply curve to the left of the equilibrium are (2,5) and (0,0) .
-Refer to Figure 3.11.At a price of $15, the quantity sold
Definitions:
Keynes
Refers to John Maynard Keynes, a British economist whose theories on government economic intervention laid the foundation for modern macroeconomics.
Work Effect
The impact on labor supply and productivity due to changes in economic policies or conditions.
Basic Assumption
An underlying principle or idea that is accepted as true without proof, forming the basis for further reasoning or behavior.
Level Of Investment
The amount of spending by businesses on capital goods, such as factories and machinery, which can influence economic growth.
Q44: A car that is produced in 2018
Q51: Refer to Table 4.7.1.Calculate the following:<br>A)Final consumption
Q79: Real GDP per capita is calculated by
Q110: In December 2015,CHCH TV cut 129 full-time
Q111: The purchase by a household in China
Q138: The market for energy drinks has become
Q149: If,in response to an increase in the
Q188: Which of the following would cause a
Q230: The labour force participation rates of men
Q252: Refer to Figure 2.4.A movement from Y