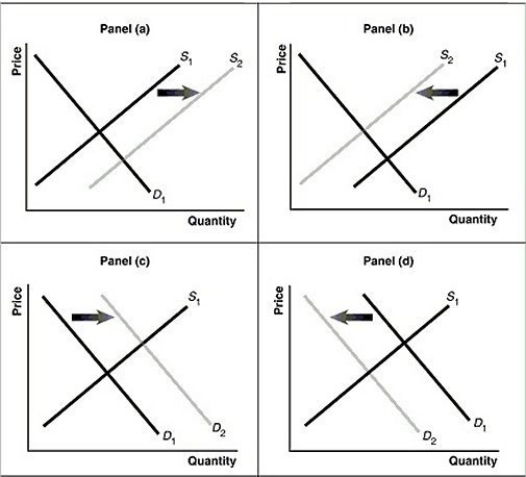
Figure 3.13  Alt text for Figure 3.13a: In figure 3.13a, a graph of intersecting demand and supply curves represents a rising supply of bicycle helmets.
Long description for Figure 3.13a: The x-axis is labelled, Quantity and the y-axis is labelled, as Price.Curve D1 is a straight line which slopes down from the top left corner to the bottom right corner.Curve S1 is a straight line which slopes up from the bottom left to the top right.The point of intersection is at the midpoints of both lines.Curve S2 is a straight line, parallel to curve S1, but plotted to the right.A right pointing arrow indicates the change from S1 to S2.
Alt text for Figure 3.13b: In figure 3.13b, a graph of intersecting demand and supply curves represents a falling supply of bicycle helmets.
Long description for Figure 3.13b: The x-axis is labelled, Quantity and the y-axis is labelled, as Price.Curve D1 is a straight line which slopes down from the top left corner to the bottom right corner.Curve S1 is a straight line which slopes up from the bottom left to the top right.The point of intersection is at the midpoints of both lines.Curve S2 is a straight line, parallel to curve S1, but plotted to the left.A left pointing arrow indicates the change from S1 to S2.
Alt text for Figure 3.13c: In figure 3.13c, a graph of intersecting demand and supply curves represents a rising demand for bicycle helmets.
Long description for Figure 3.13c: The x-axis is labelled, Quantity and the y-axis is labelled, as Price.Curve D1 is a straight line which slopes down from the top left corner to the bottom right corner.Curve S1 is a straight line which slopes up from the bottom left to the top right.The point of intersection is at the midpoints of both lines.Curve D2 is a straight line, parallel to curve D1, but plotted to the right.A right pointing arrow indicates the change from D1 to D2.
Alt text for Figure 3.13d: In figure 3.13d, a graph of intersecting demand and supply curves represents a falling demand for bicycle helmets.
Long description for Figure 3.13d: The x-axis is labelled, Quantity and the y-axis is labelled, as Price.Curve D1 is a straight line which slopes down from the top left corner to the bottom right corner.Curve S1 is a straight line which slopes up from the bottom left to the top right.The point of intersection is at the midpoints of both lines.Curve D2 is a straight line, parallel to curve D1, but plotted to the left.A left pointing arrow indicates the change from D1 to D2.
-Refer to Figure 3.13.Assume that the graphs in this figure represent the demand and supply curves for bicycle helmets.Which panel best describes what happens in this market if there is a substantial increase in the price of bicycles?
Definitions:
Native Organisms
These are species that originated in and are naturally occurring in a specific geographical area, as opposed to those that have been introduced from other areas.
Nonnative Organism
A species living outside its natural distribution area, having been introduced by human activity, either intentionally or accidentally.
Extinct Annually
The phenomenon where species of animals, plants, or other organisms disappear from the planet every year due to environmental factors, human activity, or other causes.
Environmental Dangerous
Refers to situations or conditions that pose a threat to ecological balance or public health.
Q21: The GDP deflator is a measure of
Q158: Consumption spending is $4.5 billion,investment is $3
Q162: In June,buyers of titanium expect that the
Q169: When you purchase a bicycle you do
Q187: People complain that inflation increases the cost
Q215: Which of the following statements is true?<br>A)A
Q224: Which component of consumption spending is the
Q256: Refer to Table 2.12.If the two countries
Q265: The largest component of spending in GDP
Q310: As the number of firms in a