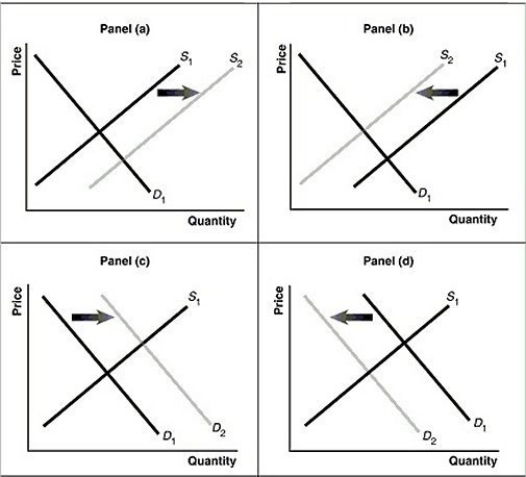
Figure 3.13  Alt text for Figure 3.13a: In figure 3.13a, a graph of intersecting demand and supply curves represents a rising supply of bicycle helmets.
Long description for Figure 3.13a: The x-axis is labelled, Quantity and the y-axis is labelled, as Price.Curve D1 is a straight line which slopes down from the top left corner to the bottom right corner.Curve S1 is a straight line which slopes up from the bottom left to the top right.The point of intersection is at the midpoints of both lines.Curve S2 is a straight line, parallel to curve S1, but plotted to the right.A right pointing arrow indicates the change from S1 to S2.
Alt text for Figure 3.13b: In figure 3.13b, a graph of intersecting demand and supply curves represents a falling supply of bicycle helmets.
Long description for Figure 3.13b: The x-axis is labelled, Quantity and the y-axis is labelled, as Price.Curve D1 is a straight line which slopes down from the top left corner to the bottom right corner.Curve S1 is a straight line which slopes up from the bottom left to the top right.The point of intersection is at the midpoints of both lines.Curve S2 is a straight line, parallel to curve S1, but plotted to the left.A left pointing arrow indicates the change from S1 to S2.
Alt text for Figure 3.13c: In figure 3.13c, a graph of intersecting demand and supply curves represents a rising demand for bicycle helmets.
Long description for Figure 3.13c: The x-axis is labelled, Quantity and the y-axis is labelled, as Price.Curve D1 is a straight line which slopes down from the top left corner to the bottom right corner.Curve S1 is a straight line which slopes up from the bottom left to the top right.The point of intersection is at the midpoints of both lines.Curve D2 is a straight line, parallel to curve D1, but plotted to the right.A right pointing arrow indicates the change from D1 to D2.
Alt text for Figure 3.13d: In figure 3.13d, a graph of intersecting demand and supply curves represents a falling demand for bicycle helmets.
Long description for Figure 3.13d: The x-axis is labelled, Quantity and the y-axis is labelled, as Price.Curve D1 is a straight line which slopes down from the top left corner to the bottom right corner.Curve S1 is a straight line which slopes up from the bottom left to the top right.The point of intersection is at the midpoints of both lines.Curve D2 is a straight line, parallel to curve D1, but plotted to the left.A left pointing arrow indicates the change from D1 to D2.
-Refer to Figure 3.13.Assume that the graphs in this figure represent the demand and supply curves for almonds.Which panel best describes what happens in this market when there is an increase in the productivity of almond harvesters?
Definitions:
Open Innovation
A paradigm that assumes firms can and should use external ideas as well as internal ideas, and internal and external paths to market, as the firms look to advance their technology.
Survey Feedback
A method of organizational development involving the collection of employees’ opinions through surveys and then sharing the results with them to initiate changes.
Intrinsic Motivation
The drive to engage in activities for their own sake, deriving pleasure and satisfaction from the activity itself rather than from external rewards.
Extrinsic Rewards
Benefits provided by an external source, such as pay or bonuses, used to motivate behavior or performance.
Q93: In a small economy in 2017 gross
Q99: The Canadian work week has declined from
Q132: Depreciation is<br>A)the value of worn-out equipment,machinery,and buildings.<br>B)the
Q135: Suppose there is some unemployment in the
Q139: Unemployment arising from a persistent mismatch between
Q143: In response to a surplus the market
Q160: Refer to Figure 3.16.The graph in this
Q191: The GDP deflator in year 2 is
Q213: Which of the following accurately describes an
Q270: High-income countries such as Canada spend a