Figure 6.1 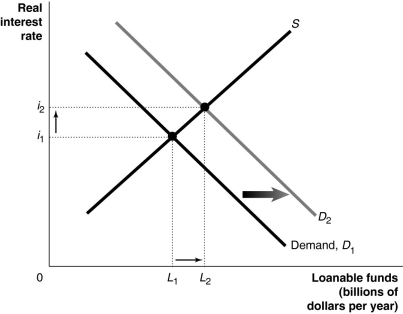 Alt text for Figure 6.1: In figure 6.1, a graph comparing loanable funds and real interest rate.
Long description for Figure 6.1: The x-axis is labelled, loanable funds (billions of dollars per year) , with values L1 and L2 marked.The y-axis is labelled, real interest rate, with values i1 and i2 marked.3 lines are plotted; Demand D1, D2 and S.Line D1 begins at the top left corner and slopes down to centre bottom.Line D2 follows the same slope as D1, but is plotted to the right.The line S begins near the origin and slopes up to the top right corner.The area between lines D1 and D2 is indicated by a right pointing arrow.Line S intersects line D1 at the point (L1, i1) , approximately 3 quarters of the way along both lines.S intersects D2 at the point (L2, i2) approximately 3 quarters of the way along both lines.These points of intersection are connected to the corresponding values on the x-axis and y-axis by dotted lines.Between the dotted lines, a rightward arrow points from L1 toward L2, and another arrow points up from i1 toward i2.
-Refer to Figure 6.1.Which of the following is consistent with the graph depicted above?
Definitions:
Rail Ticket
A document or electronic card that permits the holder to travel on a train route, either between specified points or within a defined area.
U.S. Dollar
The official currency of the United States, widely used globally as a standard for financial transactions.
Russian Ruble
The official currency of the Russian Federation, symbolized by RUB, and used within its economic transactions.
U.S. Dollar
The official currency of the United States, widely used as a standard of exchange in international transactions.
Q26: Which of the following is a correct
Q40: Eliminating all structural unemployment would be good
Q41: A lumberjack loses his job because timber
Q57: Because of diminishing returns to capital,further increases
Q66: Draw a graph of "catch-up" that shows
Q74: Explain what happens to inflation during the
Q85: Productivity gains in Canada since 1990 have
Q93: Explain and show graphically how a decrease
Q171: The small group of East Asian countries
Q218: Gross national income is defined as<br>A)the value