Figure 6.6 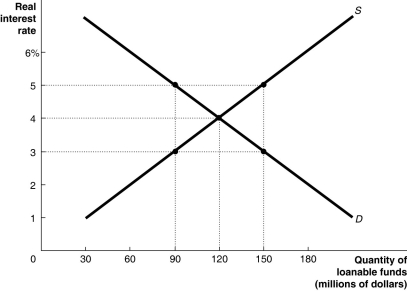 Alt text for Figure 6.6: In figure 6.6, a graph shows loanable funds market in equilibrium.
Long description for Figure 6.6: The x-axis is labelled, quantity of loanable funds (millions of dollars) , ranging from 0 to 180 in increments of 30.The y-axis is labelled real interest rate, ranging from 0 to 6% in increments of 1.2 intersecting lines are shown.A line labelled D begins at the top left corner and slopes down toward the end of the x-axis.Another line labelled S begins near the origin and slopes upward to the top right corner.5 points are plotted on these two lines as (90, 5) , (90, 3) , (120, 4) , (150, 5) , (150, 3) .These points are connected to their respective coordinates on the x-axis and y-axis using dotted lines.
-Refer to Figure 6.6.The loanable funds market is in equilibrium, as shown in the figure above.An increase in the supply of loanable funds could result in which of the following combinations of the real interest rate and quantity of loanable funds at a new equilibrium?
Definitions:
Manufacturing Overhead
All indirect manufacturing costs, including indirect labor, materials, and other expenses not directly tied to the production of goods.
Finished Goods
Finished goods refer to completed products that are ready for sale but have not yet been sold to customers.
Direct Materials Cost
The expense associated with raw materials that are directly included in the manufacturing of a product, an important component of total production cost.
Work in Process Account
A financial account found in the ledgers of manufacturing companies where costs related to the production process that are not yet complete are recorded.
Q2: Sarah is a full-time student who is
Q7: Which of the following would encourage economic
Q30: According to Joseph Schumpeter,which of the factors
Q179: Refer to Table 7.5.Consider the statistics in
Q208: Inflation redistributes income to a greater extent
Q226: Into which category of aggregate expenditure would
Q263: Refer to Table 5.2.Assume the market basket
Q274: Refer to Table 8.3.Given the consumption schedule
Q285: What does the PPI measure?<br>A)the average change
Q299: The consumption function describes the relationship between<br>A)consumption