Figure 6.6 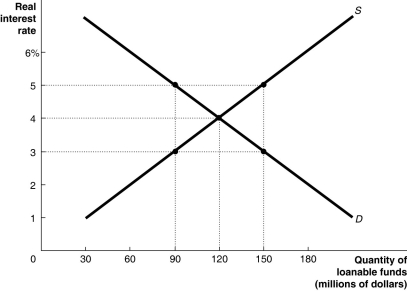 Alt text for Figure 6.6: In figure 6.6, a graph shows loanable funds market in equilibrium.
Long description for Figure 6.6: The x-axis is labelled, quantity of loanable funds (millions of dollars) , ranging from 0 to 180 in increments of 30.The y-axis is labelled real interest rate, ranging from 0 to 6% in increments of 1.2 intersecting lines are shown.A line labelled D begins at the top left corner and slopes down toward the end of the x-axis.Another line labelled S begins near the origin and slopes upward to the top right corner.5 points are plotted on these two lines as (90, 5) , (90, 3) , (120, 4) , (150, 5) , (150, 3) .These points are connected to their respective coordinates on the x-axis and y-axis using dotted lines.
-Refer to Figure 6.6.The loanable funds market is given in the figure above.If the current real interest rate is 5 percent, which of the following is true?
Definitions:
High Trust
A condition or environment in which individuals or parties have a strong belief in the reliability, integrity, and competence of each other.
Social Loafing
A phenomenon wherein people put forth less effort when they work in teams than when they work alone.
Supporting Evidence
Information or facts provided to support or validate a claim, theory, or argument.
Negotiation Process
A methodical approach to reaching a mutually acceptable agreement between two or more parties, involving communication and compromise.
Q30: If aggregate expenditure is less than GDP,how
Q35: Which of the following explains the ability
Q44: If the number of unemployed workers is
Q75: At macroeconomic equilibrium<br>A)total investment equals total inventories.<br>B)total
Q90: Which of the following will not occur
Q97: Because of diminishing returns,an economy can continue
Q105: What type of consumer goods are most
Q118: The values of real GDP and real
Q133: The quantity of goods and services that
Q233: An increase in Canada Pension Plan contributions