Starting at point B in the diagram below,identify which combinations of points illustrate technological change.Give a brief explanation to support your answer. 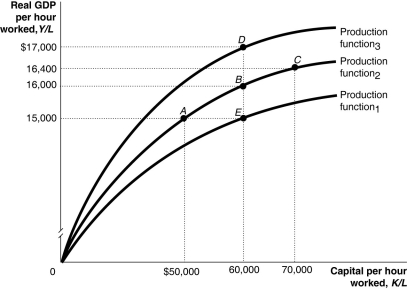 Alt text for Question 46: For question 46,a graph illustrating technological change.
Long description for Question 46: The x-axis is labelled,capital per hour worked,K/L.The y-axis is labelled,real GDP per hour worked,Y/L.3 concave curves originating from 0 at the vertex are shown.5 points,A ($50000,$15000),B ($60000,$16000),C ($70000,$16400),D ($60000,$17000),and E ($60000,$15000)are plotted.The curve labelled Production function 1,passes through point E.The curve labelled Production function 2,passes through points A,B,and C.The curve labeled Production function 3,passes through point D.The 5 points are connected to their respective coordinates on the x and y-axis with dotted lines.
Definitions:
Unqualified Indorsement
An endorsement on a financial instrument, like a check, that doesn't limit payment to any particular individual or entity.
Indorser
A person who transfers an instrument by signing (indorsing) it and delivering it to another person.
Guaranteeing Payment
The act of promising to fulfill the payment obligations of another party if they fail to pay as agreed.
Holder
An individual or entity that legally possesses a financial instrument, such as a check, bond, or stock certificate.
Q9: Of all industrialized nations,real GDP per capita
Q21: _ are financial securities that represent promises
Q65: If firms are more pessimistic and believe
Q77: In Canada,since the 1970s,expansions are more common
Q97: The effect of a recession on a
Q109: When prices are rising,which of the following
Q111: A small economy increased its capital per
Q198: According to Douglass North,the Industrial Revolution occurred
Q203: What are inventories? What usually happens to
Q216: In 2016 the federal government was forecast