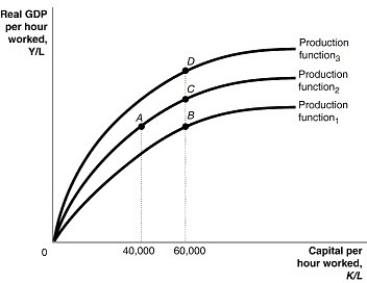
Figure 7.1  Alt text for Figure 7.1: In figure 7.1, a graph comparing capital per hour worked and real GDP per hour worked.
Long description for Figure 7.1: The x-axis is labelled, capital per hour worked, K/L, with values 40,000 and 60,000 marked.The y-axis is labelled, real GDP per hour worked, Y/L, with 0 at the vertex.3 concave curves, each originating from the vertex are shown.4 points A, B, C, and D are plotted such that point A has 40,000 as the x coordinate, and points B, C, and D have 60,000 as the x coordinate.The 3 curves pass through these points.The curve labelled, Production function 1, passes through point B.The curve labelled, Production function 2, passes through points A and C.The curve labelled, Production function 3, passes through point D.
-Refer to Figure 7.1.Many countries in Africa strongly discouraged and prohibited foreign direct investment in the 1950s and 1960s.By doing so, these countries were essentially preventing a moment from
Definitions:
Disposable Income
The amount of money individuals have available to spend and save after taxes have been deducted from their income.
Economize
The action of reducing expenditure or efficiently managing resources to avoid waste and save money.
Foreclose
The legal process by which a lender takes control of a property from a borrower due to failure to meet the repayment terms of a loan.
Defaulted
Defaulted refers to the failure to fulfill an obligation, especially the failure to repay a loan on time or to meet a contractual condition, leading to possible legal penalties or loss of rights.
Q79: You review a salesman's income over a
Q94: One drawback of the patent system is
Q126: Why is the aggregate demand curve downward
Q129: If real GDP per capita in Canada
Q164: Increasing the amount of consumption spending and
Q197: Potential GDP is estimated to grow at
Q209: A decrease in _ can put your
Q222: If the growth rate of real GDP
Q234: Which of the following will increase investment
Q260: The rapid growth of the Chinese economy