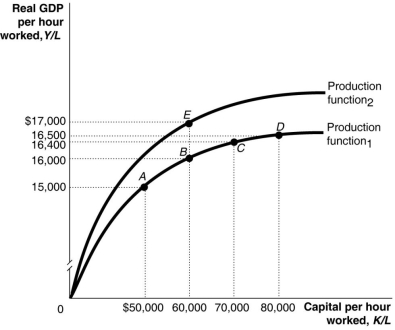
Figure 7.3  Alt text for Figure 7.3: In figure 7.3, a graph, comparing capital per hour worked and real GDP per hour worked.
Long description for Figure 7.3: The x-axis is labelled, capital per hour worked, K/L.The y-axis is labelled, real GDP per hour worked, Y/L.2 concave curves originating from 0 at the vertex are shown.5 points A ($50000, $15000) , B ($60000, $16000) , C ($70000, $16400) , D ($80000, $16500) , and E ($60000, $17000) are plotted.The curve labelled Production function 1, passes through points A, B, C, and D.The curve labelled Production function 2, passes through point E.These 5 points are connected to their respective coordinates on the x and y-axis with dotted lines.
-Refer to Figure 7.3. Many workers leaving a region is shown in the figure above by a movement from
Definitions:
Force Field Analysis
A technique used to identify and analyze the forces that either aid or hinder the achievement of a certain goal or change.
Driving Forces
Factors or motivations that compel someone to move towards a goal or change.
Status Quo
The existing state of affairs, particularly regarding social or political issues.
Personal Changes
Alterations in one's life or behavior resulting from reflection, decision-making, or external influences.
Q5: All of the following policies are ways
Q73: Economists Andy Kwan and John Cotsomitis' work
Q74: Starting at point B in the diagram
Q88: Inflation is measured<br>A)using the level of the
Q143: The formula for the multiplier is (1
Q146: Refer to Table 7.2.Calculate the GDP per
Q156: What factors increase potential GDP? Include a
Q161: Workers in high-income countries have _ to
Q209: Refer to Table 5.15.Looking at the table
Q244: Globalization refers to<br>A)the process of establishing a