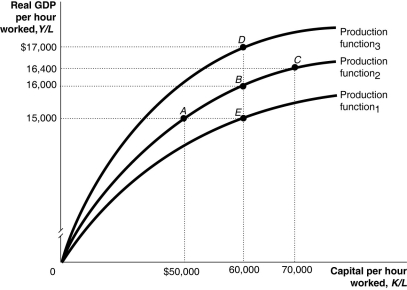
Figure 7.4  Alt text for Figure 7.4: In figure 7.4, a graph representing per-worker production functions.
Long description for Figure 7.4: The x-axis is labelled, capital per hour worked, K/L.The y-axis is labelled, real GDP per hour worked, Y/L.3 concave curves originating from 0 at the vertex are shown.5 points A ($50000, $15000) , B ($60000, $16000) , C ($70000, $16400) , D ($60000, $17000) , and E ($60000, $15000) are plotted.The curve labelled, Production function 1, passes through point E.The curve labelled, Production function 2, passes through points A, B, and C.The curve labelled, Production function 3, passes through point D.These 5 points are connected to their respective coordinates on the x-axis and y-axis with dotted lines.
-Refer to Figure 7.4.Which of the following combinations of points illustrates changes in the Soviet Union's economy from 1950 to 1980?
Definitions:
Professional Profiles
Summaries or overviews of an individual's professional qualifications, achievements, and experiences, often featured on social media or networking platforms.
Capacity
The ability, power, or competence to undertake something or the maximum amount something can contain.
Repudiated
Refused to accept or be associated with; rejected or denied the validity or authority of something.
Contract
A lawful pact made between two or more parties, which can be upheld by legal means.
Q13: Refer to Figure 7.1.Technological change is illustrated
Q36: According to new growth theory,<br>A)technological change is
Q74: If your nominal wage rises more slowly
Q110: Economic growth depends more on technological change
Q113: Actual investment spending includes spending by consumers
Q118: A decrease in the price level in
Q199: Outline the various actions the government sector
Q213: When actual inflation is less than expected
Q242: Which of the following will reduce consumer
Q284: During a(n)_,many firms experience reduced profits,which reduces