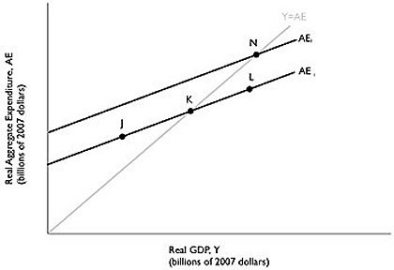
Figure 8.2  Alt text for Figure 8.2: In figure 8.2, a graph comparing real GDP and real aggregate expenditure.
Long description for Figure 8.2: Line AE1, begins a little less than half way along the x-axis and slopes up toward the end of the x-axis.Line AE2, begins at a point half way on the x-axis and slopes up to the top right corner.Line AE2 is to the left of AE1, and is on a similar path as the line AE1.Line Y = AE, originates at the vertex and slopes upward toward the top right corner.Line Y = AE meets line AE1 at point K, half way along both lines, and meets line AE2 at point N, plotted close to the right end of the line AE2.Point J is plotted a little less than half way along the line AE1, to the left of point K.Another point L is marked close to the right end of line AE1, to the right of point K.
-Refer to Figure 8.2.Suppose that the level of GDP associated with point N is potential GDP.If the Canadian economy is currently at point K,
Definitions:
Q19: For the recessions in Canada since the
Q54: A general formula for the multiplier is<br>A)
Q57: Explain how each of the following events
Q66: An increase in the price level results
Q126: Growth in Canada from 1870 to 1970
Q166: Which of the following is an example
Q187: The automatic mechanism _ the price level
Q229: Which of the following accurately describes growth
Q259: The M2 measure of money equals<br>A)currency,personal non-personal
Q293: C = 3,600 + (MPC)Y<br>I = 1,200<br>G