Figure 8.3 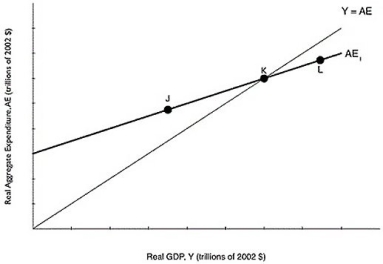 Alt text for Figure 8.3: In figure 8.3, a graph comparing real GDP and real aggregate expenditure.
Long description for Figure 8.3: The x-axis is labelled, real GDP, Y (trillions of 2002 dollars) .The y-axis is labelled, real aggregate expenditure, AE (trillions of 2002 dollars) .Line Y = AE, originates at the vertex and slopes up to the top right corner.Line AE1, begins a little less than half way along the x-axis and slopes up to the end of the x-axis.Both these lines intersect at point K, approximately 3 quarters of the way along both lines.Point J is plotted a little less than half way along line AE1, to the left of point K.Point L is marked close to the right end of the line AE1, to the right of point K.
-Refer to Figure 8.3.According to the figure above, at what point is aggregate expenditure less than GDP?
Definitions:
Q11: Which of the following is not an
Q25: All of the following are true statements
Q80: If GDP per capita rises by 2%
Q81: An increase in the price level will<br>A)shift
Q163: Does globalization promote economic growth,and how does
Q168: Would you expect to see higher or
Q171: If the desired reserve ratio is 10
Q173: If the MPC is 0.95,then a $10
Q225: Refer to Figure 7.5.Based on the "catch-up
Q259: The difference between GDP and net taxes