Figure 8.6 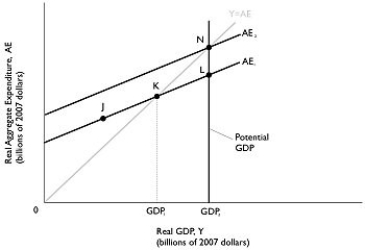 Alt text for Figure 8.6: In figure 8.6, a graph depicting potential GDP.
Long description for Figure 8.6: The x-axis is labelled, real GDP, Y (billions of 2007 dollars) , with values GDP1 and GDP2 marked.The y-axis is labelled, real aggregate expenditure, AE (billions of 2007 dollars) .Line AE1, begins a little less than half way along the x-axis and slopes up to the end of the x-axis.Line AE2, begins at a point half way along the x-axis and slopes up to the top right corner.Line AE2 is to the left of AE1 and is on a similar path as line AE1.Line Y = AE, originates at the vertex and slopes up to the top right corner.Line Y = AE meets line AE1 at point K, half way along both lines.Line Y = AE meets line AE2 at point N, plotted close to the right end of line AE2.Point J is plotted a little less than half way along line AE1, to the left of point K.Point L is plotted close to the right end of line AE1, to the right of point K.Point K is connected to its x-coordinate, GDP1, with a dotted line.A straight line, representing potential GDP, is drawn joining points N and L with their x-coordinate, GDP2, such that it is parallel to the point K to GDP1 with a dotted line.
-Refer to Figure 8.6.Potential GDP equals $100 billion.The economy is currently producing GDP1 which is equal to $90 billion.If the MPC is 0.8, then how much must autonomous spending change for the economy to move to potential GDP?
Definitions:
Freedom From Want
A concept popularized by President Franklin D. Roosevelt as one of the Four Freedoms, referring to the right to an adequate standard of living and economic security.
Consumerism
The theory or policy that promotes an increasing consumption of goods as an economic policy or social system.
Standard Of Living
Refers to the level of wealth, comfort, material goods, and necessities available to a certain socioeconomic class or geographic area.
Great Depression
A severe worldwide economic depression that took place mostly during the 1930s, beginning in the United States, marked by high unemployment and poverty.
Q23: If disposable income increases by $500 million,and
Q32: In 1973,the Club of Rome published a
Q40: The equations for C,I,G,and Nx are all
Q78: Given the equations for C,I,G,and NX below,what
Q88: The aggregate demand curve illustrates the relationship
Q168: Assume disposable income increases by 10000 and
Q174: If planned aggregate expenditure is greater than
Q239: Why do some firms choose not to
Q255: A good can serve as money only
Q269: Significant economic growth did not begin in