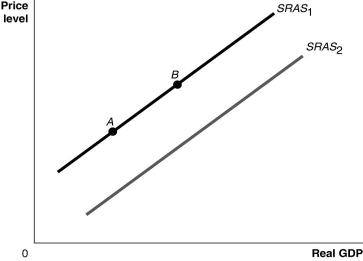
Figure 9.3  Alt text for Figure 9.3: In figure 9.3, a graph comparing real GDP and price level.
Long description for Figure 9.3: The x-axis is labelled, real GDP, with 0 at the vertex, and the y-axis is labelled, price level.2 lines are shown; SRAS1 and SRAS2.Line SRAS1 begins a little above the vertex and slopes up to the top right corner.Line SRAS2 follows the same slope as line SRAS1, but is plotted to the right.Points A and B are plotted on line SRAS1.Point A is near the left end of the line and point B is near the center of the line.
-Refer to Figure 9.3.Ceteris paribus, an increase in the price level would be represented by a movement from
Definitions:
Combined Turnover
The sum total of sales or revenues generated by different segments, departments, or subsidiaries of a company within a specified period.
Investment Opportunity
An option available to individuals or companies to invest capital with the expectation of generating a return.
Residual Income
The profit earned after deducting the cost of capital from the net operating income.
Required Rate Of Return
The minimum rate of return on an investment that investors expect to receive, taking into account the risk involved.
Q16: As a result of the drop in
Q18: A bank's assets are<br>A)things owned by or
Q37: Sales of snowmobiles tend to<br>A)increase during a
Q43: What is "brain drain"?<br>A)the tendency for highly
Q55: Money will fail to serve as a
Q57: Given the equations for C,I,G,and NX below,what
Q88: How do changes in income tax policies
Q176: The German Hyperinflation of the early 1920s
Q195: Stagflation occurs when inflation _ and GDP
Q279: Suppose that you decide that you no