Figure 9.7 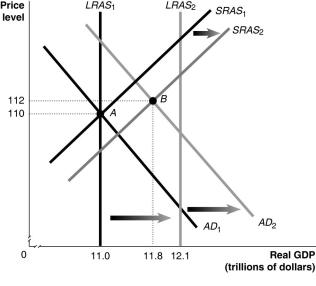 Alt text for Figure 9.7: In figure 9.7, a graph comparing real GDP and price level.
Long description for Figure 9.7: The x-axis is labelled, real GDP (trillions of dollars) , with values 11.0, 11.8, 12.1 marked.The y-axis is labelled, price level, with values 110 and 112 marked.6 lines are shown; SRAS1, SRAS2, AD1, AD2, LRAS1, LRAS2.Line SRAS1 begins near the bottom left and slopes up to the top right corner.Line SRAS2 follows the same slope as line SRAS1, but is plotted to the right.The area between lines SRAS1 and SRAS2 is indicated by a right pointing arrow.Line AD1 begins at the top left corner and slopes down toward the bottom center.Line AD2 follows the same slope as AD1, but is plotted to the right.The area between lines AD1 and AD2 is indicated by a right pointing arrow.Line LRAS1 is perpendicular to the x-axis, and begins from value 11.0.Line LRAS2 perpendicular to the x-axis, and begins from point 12.1.The area between lines LRAS1 and LRAS2 is indicated by a right pointing arrow.Line LRAS1 intersects lines AD1 and SRAS1 at point A (11.0, 110) .Lines AD2 and SRAS2 intersect at point B (11.8, 112) .Points A and B are connected to their respective coordinates on the x-axis and y-axis with dotted lines.Line LRAS2 intersects lines SRAS1 and SRAS2 on the right end of these lines.Similarly, line LRAS2 intersects lines AD1 and AD2 on the right end of these lines.
-Refer to Figure 9.7.In the figure above, LRAS1 and SRAS1 denote LRAS and SRAS in year 1, while LRAS2 and SRAS2 denote LRAS and SRAS in year 2.Given the economy is at point A in year 1, what is the growth rate in potential GDP in year 2?
Definitions:
Straight-Line Method
An accounting method of depreciation where a fixed amount is charged annually over the useful life of the asset.
Net Liability
Net liability refers to the total liabilities of an entity minus its assets, indicating a financial position where obligations exceed resources.
Accrued Interest
Interest that has been incurred but not yet paid.
Q15: Suppose there has been an increase in
Q21: Consumption spending will _ when disposable income
Q70: Which of the following is true?<br>A)The money
Q72: Use the money demand and money supply
Q77: If disposable income falls by $40 billion
Q138: An increase in real GDP<br>A)increases the buying
Q143: Suppose the economy is at full employment
Q222: The level of real GDP in the
Q240: Which of the following is an appropriate
Q263: Which of the following best describes how