Figure 9.8 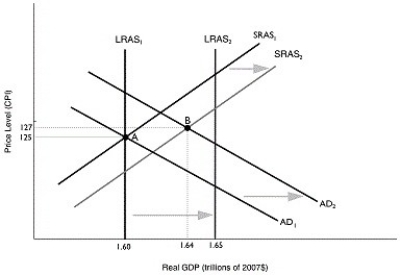 Alt text for Figure 9.8: In figure 9.8, a graph comparing real GDP and price level.
Long description for Figure 9.8: The x-axis is labelled, real GDP (trillions of dollars) , with values 1.60, 1.64, 1.65 marked.The y-axis is labelled, price level (CPI) , with values 125 and 127 marked.6 lines are shown; SRAS1, SRAS2, AD1, AD2, LRAS1, LRAS2.Line SRAS1 begins in the bottom left corner and slopes up to the top right corner.Line SRAS2 follows the same slope as line SRAS1, but is plotted to the right.The area between lines SRAS1 and SRAS2 is indicated by a right pointing arrow.Line AD1 begins at the top left corner and slopes down to the bottom center.Line AD2 follows the same slope as line AD1, but is plotted to the right.The area between lines AD1 and AD2 is indicated by a right pointing arrow.Line LRAS1 is perpendicular to the x-axis, and begins from the value 1.60.Line LRAS2 is perpendicular to the x-axis, and begins from the value 1.65.The area between lines LRAS1 and LRAS2 is indicated by a right pointing arrow.Line LRAS1 intersects lines AD1 and SRAS1 at point A (1.60, 125) .Lines AD2 and SRAS2 intersect at point B (1.64, 127) .Points A and B are connected to their respective coordinates on the x-axis and y-axis with dotted lines.Line LRAS2 intersects lines SRAS1 and SRAS2 near the right end of these lines.Similarly, line LRAS2 intersects lines AD1 and AD2 near the right end of these lines.
-Refer to Figure 9.8.Given the economy is at point A in year 1, what is the difference between the actual growth rate in GDP in year 2 and the potential growth rate in GDP in year 2?
Definitions:
Social Construction
A concept or perception of an objective reality created through social or cultural consensus, rather than existing inherently.
Sexuality
The capacity for sexual feelings, a significant aspect of a human being's identity, encompassing sexual orientation, preferences, and behaviors.
Ethical Slut
A term that challenges traditional perceptions of promiscuity, advocating for open, consensual, and responsible expressions of sexuality.
Identity Marker
Distinct characteristics, attributes, or symbols that individuals or groups use to signify their identity and differentiate themselves from others.
Q72: Use the money demand and money supply
Q94: Refer to Figure 8.7.Suppose that government spending
Q102: If aggregate expenditure is greater than GDP,how
Q117: A general formula for the multiplier is<br>A)
Q124: If the Bank of Canada orders a
Q149: If planned aggregate expenditure is greater than
Q187: If consumption is defined as C =
Q202: If the marginal propensity to save is
Q214: An increase in the interest rate should
Q228: If planned investment is equal to actual