Figure 11.9 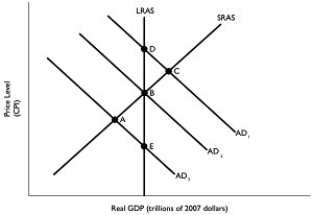 Alt text for Figure 11.9: In figure 11.9, a static AD-AS model.
Long description for Figure 11.9: The x-axis is labelled, real GDP (trillions of 2007 dollars) and the y-axis is labelled, price level (CPI) .5 lines are shown; AD1, AD2, AD3, LRAS, SRAS.Line AD1 begins in the top left corner and slopes down to the end of the x-axis.Line AD2 follows the same slope but is plotted to the left.Similarly, line AD3 is plotted to the left of line AD2.Line SRAS begins close to the vertex and slopes up to the top right corner.Line LRAS is perpendicular to the x-axis, and passes through points D, B, and E.Lines AD3 and SRAS intersect at point A.Lines AD2, LRAS, and SRAS intersect at point B.Lines AD1 and SRAS intersect at point C.Lines AD1 and LRAS intersect at point D.Lines AD3 and LRAS intersect at point E.
-Refer to Figure 11.9.Suppose the Bank of Canada lowers its target for the overnight interest rate.Using the static AD-AS model in the figure above, this situation would be depicted as a movement from
Definitions:
Q10: In the dynamic aggregate demand and aggregate
Q96: The Bank of Canada has complete control
Q120: Suppose you withdraw $1,000 in cash from
Q156: As the tax wedge associated with a
Q170: A bank's reserves equal its<br>A)vault cash.<br>B)deposits with
Q171: If the desired reserve ratio is 10
Q200: The money demand curve,against possible levels of
Q230: Suppose real GDP is currently $1.25 trillion
Q245: Refer to Figure 9.7.Given the economy is
Q296: An increase in individual income taxes _