Figure 11.10 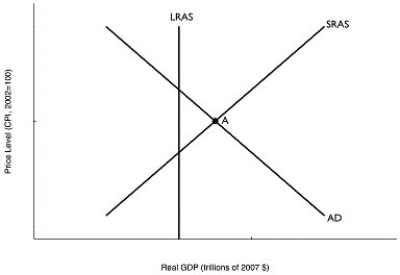 Alt text for Figure 11.10: In figure 11.10, a graph comparing real GDP and price level.
Long description for Figure 11.10: The x-axis is labelled, real GDP (trillions of 2007 dollars) and the y-axis is labelled, price level (CPI, 2002 = 100) .3 lines are shown; AD, LRAS, SRAS.Line AD begins in the top left corner and slopes down to the end of the x-axis.Line SRAS begins in the bottom left corner and slopes up to the top right corner.Line LRAS is perpendicular to the x-axis, and intersects the lines AD and SRAS.The point of intersection of lines AD and SRAS is marked as A.
-Refer to Figure 11.10.In the figure above, if the economy is at point A, the appropriate monetary policy by the Bank of Canada would be to
Definitions:
Q74: Which of the following statements about inflation
Q83: Suppose that the desired reserve ratio is
Q93: The Taylor Principle says that when the
Q97: Expansionary monetary policy to prevent real GDP
Q113: Borrowing to pay for long-lived capital expenditures
Q156: As the tax wedge associated with a
Q207: Firms that participate in regular open market
Q237: When a grocery store accepts your $5
Q243: The Bank of Canada can directly affect
Q253: An increase in the money supply is