Figure 11.13 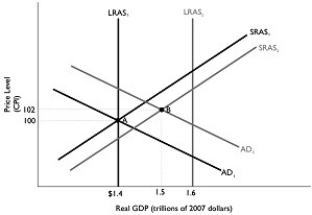 Alt text for Figure 11.13: In figure 11.13, a dynamic model of AD-AS.
Long description for Figure 11.13: The x-axis is labelled, real GDP (trillions of 2007 dollars) , with values $1.4, 1.5, 1.6 marked.The y-axis is labelled, price level (CPI) , with values 100 and 102 marked.6 lines are shown; SRAS1, SRAS2, AD1, AD2, LRAS1, LRAS2.Line SRAS1 begins in the bottom left and slopes up to the top right corner.Line SRAS2 follows the same slope as line SRAS1, but is plotted to the right.Line AD1 begins at the top left corner and slopes down to the end of the x-axis.Line AD2 follows the same slope as AD1, but is plotted to the right.Line LRAS1 is perpendicular to the x-axis, and begins from the x-axis value $1.4.Line LRAS2 is perpendicular to the x-axis, and begins from the value 1.6.Line LRAS1 intersects line AD1 and SRAS1 at point A ($1.4, 100) .Lines AD2 and SRAS2 intersect at point B (1.5, 102) .Points A and B are connected to their respective coordinates on the x-axis and y-axis with dotted lines.Line LRAS2 intersects lines SRAS1 and SRAS2 on the right end of these lines.Similarly, line LRAS2 intersects lines AD1 and AD2 toward the right end of these lines.
-Refer to Figure 11.13.In the dynamic model of AD-AS in the figure above, if the economy is at point A in year 1 and is expected to go to point B in year 2, the Bank of Canada would most likely
Definitions:
Social Media Tools
Digital platforms and technologies used to create, share, and manage content for social networking.
Three Fs of Selling
A sales philosophy that emphasizes the importance of Feelings, Features, and Facts in the process of persuading potential customers.
FAB
Features, Advantages, and Benefits; a sales and marketing strategy that outlines a product's features, explains its advantages over competing products, and details the benefits to the customer.
Forecasts
Predictions or estimates of future events or trends, such as sales, weather, or economic conditions, based on analysis of past and present data.
Q3: Increases in the price level<br>A)increase the opportunity
Q14: Assume an asset costs $100.The asset will
Q72: Use the money demand and money supply
Q75: In a closed economy with fixed or
Q78: Suppose real GDP is $1.7 trillion and
Q87: Bank reserves include<br>A)vault cash and deposits with
Q196: Does the short-run Phillips curve have a
Q211: The dynamic aggregate demand and aggregate supply
Q225: The Bank of Canada can directly lower
Q241: To increase the money supply,the Bank of