Figure 11.13 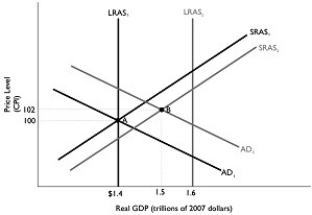 Alt text for Figure 11.13: In figure 11.13, a dynamic model of AD-AS.
Long description for Figure 11.13: The x-axis is labelled, real GDP (trillions of 2007 dollars) , with values $1.4, 1.5, 1.6 marked.The y-axis is labelled, price level (CPI) , with values 100 and 102 marked.6 lines are shown; SRAS1, SRAS2, AD1, AD2, LRAS1, LRAS2.Line SRAS1 begins in the bottom left and slopes up to the top right corner.Line SRAS2 follows the same slope as line SRAS1, but is plotted to the right.Line AD1 begins at the top left corner and slopes down to the end of the x-axis.Line AD2 follows the same slope as AD1, but is plotted to the right.Line LRAS1 is perpendicular to the x-axis, and begins from the x-axis value $1.4.Line LRAS2 is perpendicular to the x-axis, and begins from the value 1.6.Line LRAS1 intersects line AD1 and SRAS1 at point A ($1.4, 100) .Lines AD2 and SRAS2 intersect at point B (1.5, 102) .Points A and B are connected to their respective coordinates on the x-axis and y-axis with dotted lines.Line LRAS2 intersects lines SRAS1 and SRAS2 on the right end of these lines.Similarly, line LRAS2 intersects lines AD1 and AD2 toward the right end of these lines.
-Refer to Figure 11.13.In the dynamic model of AD-AS in the figure above, if the economy is at point A in year 1 and is expected to go to point B in year 2, and the Bank of Canada pursues no policy, then at point B
Definitions:
Overreliance On Volume
The high dependency on sales volume to drive profit, risking profitability if volume decreases.
Overhead Applied
The allocation of manufacturing overhead to individual products or job orders based on a predetermined rate.
Actual Activity
The real measure of the volume of production or operation activities undertaken by a company within a specified period.
Estimated Overhead Cost
Estimated overhead cost refers to a projection or forecast of the total indirect expenses that will be incurred during a specified period in the production process.
Q3: In a graph of unemployment rates (on
Q54: Which of the following could explain why
Q88: For the federal deficit to be lowered,<br>A)the
Q127: Refer to Figure 12.1.An increase in taxes
Q142: Refer to Scenario 10.2.As a result of
Q191: During World War II,prisoners of war used
Q224: For purposes of monetary policy,the Bank of
Q245: Refer to Figure 9.7.Given the economy is
Q261: If money demand is extremely sensitive to
Q280: The cyclically adjusted budget deficit or surplus