Figure 11.13 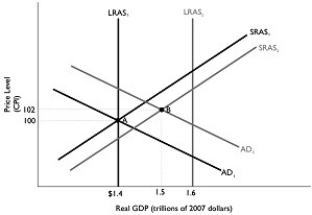 Alt text for Figure 11.13: In figure 11.13, a dynamic model of AD-AS.
Long description for Figure 11.13: The x-axis is labelled, real GDP (trillions of 2007 dollars) , with values $1.4, 1.5, 1.6 marked.The y-axis is labelled, price level (CPI) , with values 100 and 102 marked.6 lines are shown; SRAS1, SRAS2, AD1, AD2, LRAS1, LRAS2.Line SRAS1 begins in the bottom left and slopes up to the top right corner.Line SRAS2 follows the same slope as line SRAS1, but is plotted to the right.Line AD1 begins at the top left corner and slopes down to the end of the x-axis.Line AD2 follows the same slope as AD1, but is plotted to the right.Line LRAS1 is perpendicular to the x-axis, and begins from the x-axis value $1.4.Line LRAS2 is perpendicular to the x-axis, and begins from the value 1.6.Line LRAS1 intersects line AD1 and SRAS1 at point A ($1.4, 100) .Lines AD2 and SRAS2 intersect at point B (1.5, 102) .Points A and B are connected to their respective coordinates on the x-axis and y-axis with dotted lines.Line LRAS2 intersects lines SRAS1 and SRAS2 on the right end of these lines.Similarly, line LRAS2 intersects lines AD1 and AD2 toward the right end of these lines.
-Refer to Figure 11.13.In the dynamic model of AD-AS in the figure above, the economy is at point A in year 1 and is expected to go to point B in year 2, and the Bank of Canada pursues the appropriate policy.This will result in
Definitions:
Infection
The invasion and multiplication of microorganisms such as bacteria, viruses, and parasites that are not normally present within the body.
Purulent Drainage
A type of thick, often yellowish fluid that is produced at the site of an infection, indicating the presence of pus.
Pressure Ulcer
A localized injury to the skin and/or underlying tissue, typically over a bony area, as a result of pressure or pressure in combination with shear and/or friction.
Dressing
A sterile pad or compress applied to a wound to promote healing and protect the area from further harm.
Q4: During 2008-2009,falling oil prices<br>A)shifted the Canadian short-run
Q34: To increase the money supply,the Bank of
Q40: A relationship that depends on the basic
Q40: Some economists argue that the federal government
Q95: Why do banks create money? Do they
Q103: Federal government purchases,as a percentage of GDP,<br>A)have
Q153: If the Scotiabank in Waterloo receives a
Q198: Parliament carries out fiscal policy through changes
Q219: According to the _ Phillips curve(s),the unemployment
Q224: Inflation is generally the result of total