Figure 12.1 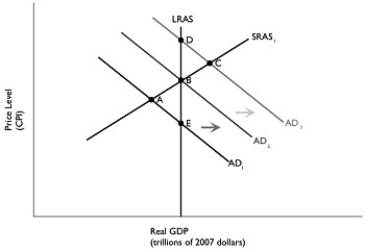 Alt text for Figure 12.1: In figure 12.1, a graph comparing real GDP and price level.
Long description for Figure 12.1: The x-axis is labelled, real GDP (trillions of 2007 dollars) and the y-axis is labelled, price level (CPI) .5 lines are shown; AD1, AD2, AD3, LRAS, and SRAS1.Line AD1 begins in the top left corner and slopes down to the end of the x-axis.Line AD2 follows the same slope, but is plotted to the right.Similarly, line AD3 also has the same slope and is plotted to the right of AD2.Line SRAS1 begins close to the vertex and slopes up to the top right corner.Line LRAS is perpendicular to the x-axis, passing through points D, B, and E.Lines AD1 and SRAS1 intersect at point A.Lines AD2, LRAS, and SRAS1 intersect at point B.Lines AD3 and SRAS1 intersect at point C.Lines AD1 and LRAS intersect at point E.Lines AD3 and LRAS intersect at point D.The area between lines AD1 and AD2 is indicated by a right pointing arrow.The area between lines AD2 and AD3 is indicated by a right pointing arrow.
-Refer to Figure 12.1.Suppose the economy is in short-run equilibrium above potential GDP and automatic stabilizers move the economy back to long-run equilibrium.Using the static AD-AS model in the figure above, this would be depicted as a movement from
Definitions:
Indifference Curve
An indifference curve is a graph that shows a combination of two goods that give a consumer equal satisfaction and utility.
Normal Good
A good for which demand increases when income increases and falls when income decreases, all other factors being equal.
Income Increased
A rise in the amount of money earned from work, investments, or other sources.
Consumption of Strawberries
Refers to the amount of strawberries that are eaten or used by consumers within a specific period.
Q7: If the Bank of Canada orders an
Q34: Contractionary monetary policy on the part of
Q59: How are firms in the shadow banking
Q65: The 12 outside directors of the board
Q174: Refer to Figure 13.2.Suppose the economy is
Q182: In the _,A.W.Phillips plotted data for Great
Q194: Refer to Figure 11.3.In the figure above,when
Q211: An increase in the demand for government
Q259: Fiscal policy actions that are intended to
Q266: Suppose that the current equilibrium GDP is