Figure 12.7 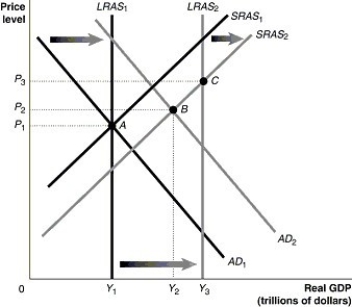 Alt text for Figure 12.7: In figure 12.7, a graph comparing real GDP and price level.
Long description for Figure 12.7: The x-axis is labelled, real GDP (trillions of dollars) , with points Y1, Y2, and Y3 marked.The y-axis is labelled, price level, with points P1, P2, and P3 marked.6 lines are shown; SRAS1, SRAS2, AD1, AD2, LRAS1, and LRAS2.Line SRAS1 begins in the bottom left corner and slopes up to the top right corner.Line SRAS2 follows the same slope as line SRAS1, but is plotted to the right.The space between lines SRAS1 and SRAS2 is indicated by a right pointing arrow.Line AD1 begins at the top left corner and slopes down to the bottom center.Line AD2 follows the same slope as line AD1, but is plotted to the right.The area between lines AD1 and AD2 is indicated by a right pointing arrow.Line LRAS1 is perpendicular to the x-axis, and begins from the x-axis value Y1.Line LRAS2 is perpendicular to the x-axis, and begins from the x-axis value Y3.The are between lines LRAS1 and LRAS2 is indicated by a right pointing arrow.Line LRAS1 intersects lines AD1 and SRAS1 at point A (Y1, P1) .Lines AD2 and SRAS2 intersect at point B (Y2, P2) .Line LRAS2 intersects line SRAS2 at point C (Y3, P3) .Points A, B, and C are connected to their respective coordinates on the x and y-axis with dotted lines.
-Refer to Figure 12.7.Given that the economy has moved from A to B in the graph above, which of the following would be the appropriate fiscal policy to achieve potential GDP?
Definitions:
Policy Proposal
A plan or suggestion, especially one formally put forward for consideration by others, regarding a specific political or organizational policy.
Defend
To protect or support a particular idea, policy, or entity against criticism or attack.
Develop
To grow, evolve, or expand in capabilities, skills, or ideas through a process of education, practice, or effort.
Preventive Strategies
Approaches designed to stop problems or issues from occurring, aiming to limit or eliminate negative outcomes through proactive measures.
Q44: What can the Bank of Canada do
Q52: If rational workers and firms know that
Q106: If workers and firms ignore inflation or
Q106: What economic impact would the closing of
Q122: Refer to Figure 12.2.In the graph above,if
Q139: The _ curves are both vertical.<br>A)aggregate demand
Q165: According to the "rational expectations" school of
Q216: Which of the following is not a
Q223: The Bank of Canada maintains an operating
Q265: With which of the following statements would