Figure 13.11 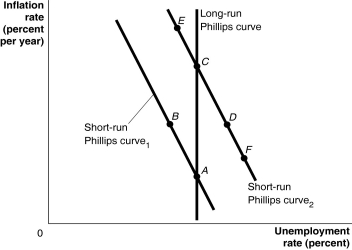 Alt text for Figure 13.11: In figure 13.11, a graph of the Phillips curve.
Long description for Figure 13.11: The x-axis is labelled, unemployment rate percent, and the y-axis is labelled, inflation rate percent per year.A straight line labelled, short-run Philips Curve 1, begins at the top left corner and slopes down to the bottom center.A straight line labelled, short-run Philips Curve 2, follows the same slope as Curve 1, but is plotted to the right.A straight line labelled, long-run Philips Curve, is perpendicular to the x-axis, and intersects the short-run Philips Curve 1, at point A on the bottom end of both lines.Point B is plotted half way along the short-run Philips Curve 1.Long-run Philips Curve, intersects the short-run Philips Curve 2, at point C in the top half of both lines.Point D is plotted more than half-way along short-run Philips Curve 2.Points E and F are plotted close to the left and right ends, respectively, of the short-run Philips Curve 2.
-Refer to Figure 13.11.A supply shock, such as rising oil prices, would be depicted as a movement from ________.
Definitions:
Q23: Since 1965,the largest federal budget deficit (as
Q32: During a time when the inflation rate
Q50: A real appreciation of the Canadian dollar
Q64: Under a floating exchange rate,the exchange rate<br>A)will
Q71: The cyclically adjusted budget deficit calculates the
Q105: Use the information below to explain adjustments
Q129: If the Bank of Canada chooses to
Q169: Based on the following information,calculate public saving,net
Q197: Which of the following would decrease the
Q202: Which of the following is not included