Figure 13.11 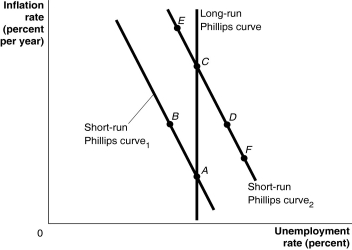 Alt text for Figure 13.11: In figure 13.11, a graph shows the short-run and long-run Phillips curves.
Long description for Figure 13.11: The x-axis is labelled, unemployment rate percent, and the y-axis is labelled, inflation rate percent per year.A straight line labelled, short-run Philips Curve 1, begins at the top left corner and slopes down to the bottom center.A straight line labelled, short-run Philips Curve 2, follows the same slope as Curve 1, but is plotted to the right.A straight line labelled, long-run Philips Curve, is perpendicular to the x-axis, and intersects the short-run Philips Curve 1 at point A near the bottom end of both lines.Point B is plotted half way along the short-run Philips Curve 1.Long-run Philips Curve intersects short-run Philips Curve 2 at point C near the top half of the curves.Point D is plotted more than half way along the short-run Philips Curve 2.Points E and F are plotted close to the left and right ends, respectively, of the short-run Philips Curve 2.
-Refer to Figure 13.11.A follower of the new classical macroeconomics would argue that ________, like that pursued by the Bank of Canada in 1979, would result in a movement from C to A.
Definitions:
Adolescent Siblings
Brothers and sisters in their teenage years, a period marked by significant growth, change, and development.
Deviance
Behaviors or actions that violate societal norms or expectations.
White-Collar Crime
Non-violent crime committed by individuals, typically for financial gain, within their occupational roles.
Society's Cost
Refers to the economic and social costs borne by the society at large, as a result of individual or corporate activities, which are not reflected in the price of goods or services, including pollution, health issues, and social disparities.
Q6: Refer to Figure 14.1.The French fall in
Q21: Refer to Figure 13.2.Suppose the economy is
Q32: If Canada is a "net lender" abroad,_.(Assume
Q170: A decrease in Canadian federal government budget
Q210: If the government finances an increase in
Q224: Poorly timed discretionary policy can do more
Q226: According to the short-run Phillips curve,the unemployment
Q242: An increase in the expected inflation rate
Q244: Refer to Figure 12.4.In the graph above,suppose
Q268: Reducing the marginal tax rate on income