Figure 14.1 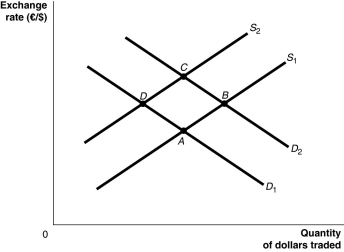 Alt text for Figure 14.1: In figure 14.1, a graph illustrates the quantity of dollars traded against the exchange rate.
Long description for Figure 14.1: The x-axis is labelled, quantity of dollars traded, and the y-axis is labelled, exchange rate, euros against dollars.2 supply curves; S1 and S2, and two demand curves; D1 and D2 are plotted.Supply curve S1 is a straight line which slopes up from the bottom left corner to the top left corner, and passes through points A and B.Supply curve S2 is a straight line with the same slope as S1, but plotted above.S2 passes through points D and C.Demand curve D1 is a straight line, which slopes down from the top left corner to the bottom right corner.Curve D1 intersects curve S1 at point A, and curve S2 at point D.Demand curve D2 is a straight line with the same slope as D1, but plotted above.Curve D2 intersects curve S1 at point B, and curve S2 at point C.
-Refer to Figure 14.1.Suppose that Canadian government deficits cause interest rates in Canada to rise relative to those in the European Union.Assuming all else remains constant, how would this be represented?
Definitions:
Drilling Expense
Costs associated with the process of drilling, such as those incurred in the exploration and production of oil and gas resources.
Interest Capitalization Period
The time frame during which interest expense incurred on debt during the construction of an asset is capitalized and added to the cost basis of the asset, rather than being expensed immediately.
Accumulated Depreciation
The cumulative amount of depreciation cost that has been applied to a tangible asset from the time it was initially utilized.
Legal Fees
Expenses paid or incurred for legal services, which businesses may incur in the course of operations or dispute resolution.
Q30: Refer to Figure 15.6.Which of the following
Q55: Explain how "net capital flows" are related
Q63: Ceteris paribus,a decrease in the government's budget
Q71: When the market value of the dollar
Q92: If the average productivity of Canadian firms
Q105: If the federal budget goes from a
Q180: An appreciating yen makes Japanese products<br>A)more expensive
Q192: A typical society strives to get the
Q195: The tax multiplier is calculated as one
Q228: How can tax simplification be beneficial to