Figure 15.4 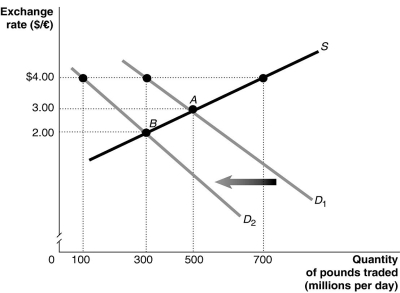 Alt text for Figure 15.4: In figure 15.4, a graph illustrates the quantity of pounds traded against the exchange rate.
Long description for Figure 15.4: The x-axis is labelled, quantity of pounds traded in millions per day.The y-axis is labelled, exchange rate, Canadian dollar against the pound.A straight line supply curve, S, slopes up from the middle left to the top right corner.2 straight line demand curves, D1 and D2, have 2 slightly different slopes.Both curves slope down from the top left corner to the bottom right corner.Curve D2 is plotted to the left of curve D1.The difference between the curves is indicated by a left pointing arrow.Curve S intersects curves D1 and D2 at points A (500, 3.00) and B (300, 2.00) .Point (300, 4.00) is plotted near the top of curve D1, and point (100, 4.00) is plotted near the top of curve D2.All points are connected to their corresponding values on the x and y-axes with dotted lines.
-Refer to Figure 15.4.The equilibrium exchange rate is at A, $3/pound.Suppose the British government pegs its currency at $4/pound.Speculators expect that the value of the pound will drop and this shifts the demand curve for pounds to D2.After the shift,
Definitions:
Internships
Professional work experiences that provide learners or new professionals exposure to their field of interest, often as a part of their education.
Subjective
Based on or influenced by personal feelings, tastes, or opinions, rather than external facts.
Plan
A detailed proposal for achieving specific goals or tasks, outlining strategies, actions, and resources needed.
Summarization
The process of condensing information to present the main points succinctly.
Q38: When the government redistributes income from the
Q74: Explain how an attempt by the government
Q90: If the Bank of Canada chose to
Q125: An example of an externality is the
Q126: From the beginning of 2002 until 2015,the
Q162: Productivity is defined as the quantity of
Q168: Which of the following would be the
Q229: If the Bank of Canada announces that
Q276: When the government implements programs such as
Q297: Low rates of inflation are generally associated