Figure 15.5 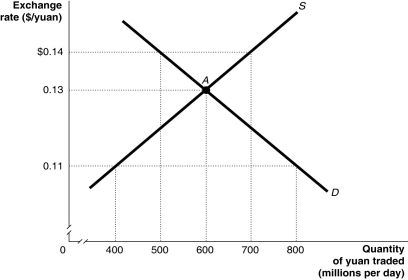 Alt text for Figure 15.5: In figure 15.5, a graph illustrates the quantity of yuan traded against the exchange rate.
Long description for Figure 15.5: The x-axis is labelled, quantity of yuan traded in millions per day.The y-axis is labelled, exchange rate, Canadian dollar against the yuan.Supply curve S, is a straight line which slopes up from the bottom left corner to the top right corner.Demand curve D, is a straight line which slopes down from the top left corner to the bottom right corner.The curves intersect at point A, (600, 0.13) .Point A, and unmarked points (800, 0.11) , (500, $0.14) , (700, $0.14) , and (400, 0.11) are all connected to their corresponding values on the x and y-axes with dotted lines.
-Refer to Figure 15.5.Suppose the Chinese government decides to abandon pegging the yuan to the U.S.dollar at a rate which undervalues the yuan.Using the figure above, the equilibrium exchange rate would be ________ and Chinese exports to the United States would ________ in price.
Definitions:
Control
Refers to the power to influence or direct people's behavior or the course of events.
Interest Income
Income earned from the lending of money or from depositing funds in interest-bearing accounts.
Banks
Financial institutions licensed to receive deposits and provide financial services, including loans, to individuals and businesses.
Economic Benefit
The gain received when money, goods, or services are obtained or when a financial burden is lifted.
Q15: Among countries that purchased Canadian stocks and
Q24: Which of the following claims is consistent
Q25: Suppose the GDP deflator in Canada is
Q92: Market power refers to the<br>A) power of
Q92: If the average productivity of Canadian firms
Q107: Net foreign investment is a measure of
Q122: If Canada has a net export surplus,which
Q156: Expansionary monetary policy lowers interest rates and
Q247: Contractionary monetary policy and expansionary fiscal policy
Q276: The purchase of foreign stocks and bonds