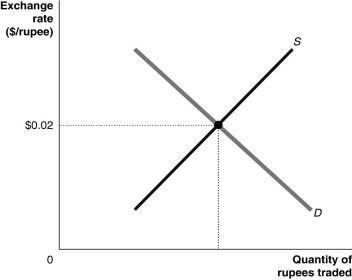
Figure 15.8  Alt text for Figure 15.8: In figure 15.8, a graph illustrates the quantity of rupees traded against the exchange rate.
Long description for Figure 15.8: The x-axis is labelled, quantity of rupees traded.The y-axis is labelled exchange rate, Canadian dollar against the rupee, with value 0.02 marked.A straight line supply curve, S, slopes up from the bottom left corner to the top right corner.A straight line demand curve, D, slopes down from the top left corner to the bottom right corner.Curves S and D intersect at point with a y-axis value of 0.02, which is connected to the corresponding y-axis value with a dotted line.
-Refer to Figure 15.8.If the Indian government pegs its currency to the Canadian dollar at a value below $.02/rupee, we would say the currency is
Definitions:
Recession
A period of temporary economic decline during which trade and industrial activity are reduced, generally identified by a fall in GDP in two successive quarters.
Investor Sentiment
The overall attitude of investors towards a particular security or financial market, which can influence trading decisions and market movements.
Efficient Frontier
The efficient frontier is a concept in modern portfolio theory representing those portfolios that offer the highest expected return for a defined level of risk or the lowest risk for a given level of expected return.
Minimum Risk Portfolios
Investment strategies that aim to minimize the overall risk of a portfolio through diversification and asset allocation.
Q9: If the purchasing power of the Canadian
Q27: The current account deficits incurred by the
Q66: The three most important financial centres in
Q96: The 1989-1993 Bank of Canada adoption of
Q134: Explain why international capital markets have expanded
Q145: Refer to Figure 15.8.If the Indian government
Q168: When government policies are enacted,<br>A) equality can
Q188: During what period of time did Canada
Q218: Foreign purchases of Canadian securities rose dramatically
Q275: Inflation is the primary determinant of a