Figure 15.9 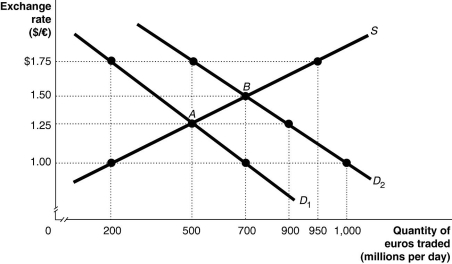 Alt text for Figure 15.9: In figure 15.9, a graph illustrates the quantity of euros traded against the exchange rate.
Long description for Figure 15.9: The x-axis is labelled, quantity of euros traded in millions per day.The y-axis is labelled, exchange rate, Canadian dollar against the euro.A straight line supply curve, S, slopes up from the bottom left corner to the top right corner.2 straight line demand curves, D1 and D2, slope down from the top left corner to the bottom right corner.Curve D2 is plotted to the right of curve D1.The difference between the curves is indicated by a right pointing arrow.Curve S intersects curves D1 and D2 at points A (500, 1.25) and B (700, 1.50) .Point (200, 1.00) is plotted near the bottom of curve S.Point (950, 1.75) is plotted near the top of curve S.Point (500, 1.75) is plotted near the top of curve D2.Points (900, 1.25) and point (1,000, 1.00) are plotted near the bottom of curve D2.Point (200,1.75) is plotted near the top of curve D1.Point (700, 1.00) is plotted near the bottom of curve D1.All points are connected to their corresponding values on the x and y-axes with dotted lines.
-Refer to Figure 15.9.The equilibrium exchange rate is at A, $1.25/euro.Suppose the European Central Bank pegs its currency at $1.00/euro.At the pegged exchange rate,
Definitions:
Résumés
Written compilations of a person's education, work experience, qualifications, and accomplishments, used as part of a job application.
Part-Time
Employment with fewer hours per week compared to full-time positions, offering limited work time and often fewer benefits.
Gross Pay
The total pay, which is the sum of an employee’s hourly pay and overtime pay.
Social Security Tax
A mandatory government tax taken from workers' earnings to fund the Social Security program, which provides retirement, disability, and survivor benefits.
Q18: Refer to Figure 13.10.A response to persistent
Q76: Adoption of the euro as both a
Q91: The U.S.president who referred to inflation as
Q172: Maureen's college raises the cost of room
Q178: In Canada today,how much gold will the
Q215: Catherine buys and sells real estate.Two weeks
Q261: U.S.laws requiring that drivers wear seat belts
Q266: A tax on gasoline is an incentive
Q332: Economists use the word equality to describe
Q503: Economists face an obstacle that many other